Analysis of New Zealand universities’ research performance under the PBRF
1 Indicators of how the PBRF lifted university research performance
To support the 2012/2013 policy review of the PBRF, the Ministry of Education produced a set of reports that looked into the first three PBRF QE rounds. As part of that, the Ministry tracked the country’s tertiary education institutions’ (TEIs’) share of indexed research publications and the share of world citations from before the introduction of the PBRF until 2011.
This graph, drawn from Warren Smart’s 2013 report Analysis of the impact of the PBRF – interim findings, displays the trends.

Figure 1 shows that from the introduction of the PBRF in 2003, the share of world publications by New Zealand TEIs has increased significantly. The share of world indexed publications has increased from 0.40 percent in 2000-2004 to 0.46 percent in 2007-2011. The increase in the share of world indexed citations was even more impressive, rising from 0.34 percent in 2001-2005 to 0.49 percent in 2007-2011. That suggests that the real lift was in the quality and academic impact of the research published (though quantity also increased).
Both lines had begun increasing earlier than the PBRF introduction. It’s possible that the initial improvement was a response to ongoing discussions of how to change tertiary education funding – including research funding (and, consequently, research performance) – that were initiated by the government in the mid/late 1990s. The real spike in citations, however, pretty much coincided with the development and initiation of the PBRF.
The trends shown in Figure 1 are also evident in the data on the individual universities, with all eight showing a rise in citations, relative to the international trend.
2 Bibliometric performance of NZ universities
Figure 2 tracks the bibliometric performance of New Zealand universities between 2006 and 2021. Over that period, there was a 69% increase in indexed publications with NZ university authors, while indexed publications across all world universities rose by 92%.
What is more important is the quality and impact of the New Zealand university papers. Therefore we look at two measures that give evidence of growth in quality:
- the Mean Normalised Citations Score (MNCS) that measures how the number of citations attracted by papers compares with all citations of research papers, normalised for field of study. A MNCS of 1.0 means that the papers have attracted the average number of citations of all papers in those fields, while a score greater than 1.0 indicates papers that have attracted an above average number of cites
- the proportion of published papers .in the top 10% of journals, where the journal ranking depends on the journal’s ability to attract citations
In both measures, in the 2018 to 2021 period, NZ universities in the period are ahead of where they were in 2006-2009, which is near the start of the PBRF period. See Figure 2.
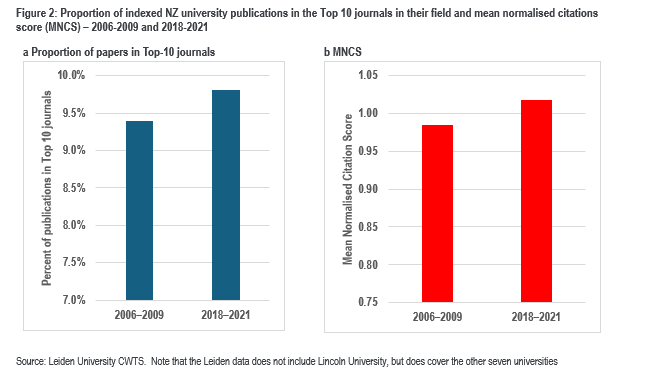
In particular, the MNCS has increased from 0.98 – just below the average – to 1.02, just above the average. The MNCS has hovered around the 1.02 to 1.03 mark since 2010. The proportion in the top 10% journals has also stabilised – varying between just under 10% to just over 10%.
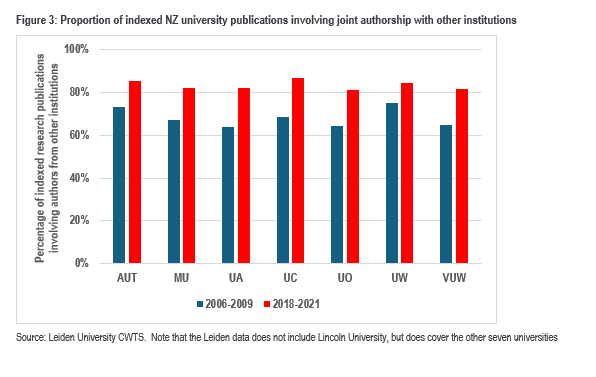
3 Collaboration in NZ university research
One frequent criticism of the PBRF is that it is thought to have dis-incentivised research collaboration because the QE assesses individual academics’ work. This belief is repeated in the most recent comprehensive review of the PBRF (Smith et al (2020) – see page 3).
Now there are many kinds of creative work considered in the QE – applied research, designs, fine art works, creative writing, as well as the kind of traditional basic scientific research that appears in research journals that are indexed in the Scopus or Clarivate research databases.
Without a great deal of work, it’s not possible to check out trends in collaboration in fine arts, creative writing and design. But bibliometric data gives a view of the extent of collaboration across institutional boundaries. That analysis shows that the PBRF has been accompanied by an increase on inter-institutional authorship of indexed research papers, in all NZ universities covered in the Leiden University CWTS database. See Figure 3.