This Appendix covers the three articles on the PBRF on this site.
It has three sections:
- Bibliometric data – what are the sources of bibliometric data
- Using bibliometric analysis – the detail of the analysis in the third article in the series
- Other measures of scale – the detail of the alternatives to bibliometric data to allocate research funding between institutions, as discussed in the third article
1 Bibliometric data
What are bibliometric databases
The proposed scale measure proposed in this article involves a count of indexed research publications over a six-year period. That requires sourcing data on publications from a bibliometric database – a database that records publications that appear in research journals and also that count citations. These databases include the names and affiliations of all the authors; thus, they allow us to count the number of publications that are authored (or co-authored) by people with an affiliation to an institution – which is what is needed for the proposed scale measure.
Fractional and total counts
Nearly all research papers have multiple authors. In many cases, some of the contributors will have different affiliations. Each affiliated institution is entitled to count that publication in its research output.
If a paper had six authors, three from University A, two from University B and one from University C. If it had attracted, say, 120 citations, then there are two methods of counting the output[1].
- Under the total counting method, each of A, B and C records this as one paper and 120 cites.
- Under fractional counting, A counts 0.5 publications and 60 cites, B counts 0.33 publications and 40 cites, while C records 0.17 publications and 20 cites.
Given the purpose of the bibliometric counts in this proposal, we need fractional counting in this case (Smyth 2023).
Bibliometric databases
The two best known commercial bibliometric databases are Clarivate Analytics Web of Science (WoS) and Scopus, developed and owned by Netherlands scientific publisher Elsevier[2].
In addition, bibliometric data is available from Google Scholar and MicroSoft Academic and ResearchGate, but (according to Pranckuté (2021)) the curation and reliability of these open access databases is uncertain.
A newer product, DimensionsAI by Digital Sciences, which also is a subscription-based product has emerged as a rival to the WoS and Scopus; Pranckuté (2021) states that “ … relatively little is known regarding its comprehensiveness and validity…”. Dimensions claims to be the largest database and it integrates with number of tools, including ChatGPT. It may be that Dimensions comes to be seen, over time, to be user-friendly, reliable and comprehensive (Pranckuté (2021)), but in the short term, the choice is between Scopus and WoS.
Leiden University’s Centre for Science and Technology Studies (CWTS), curates WoS data and makes it available for free download with a large number of useful bibliometric indicators. That open access to WoS bibliometric analysis for those without a WoS licence (and for those without advanced database analytical tools). CWTS has also curated corresponding bibliometric data for open access journals[3].
There are also discipline specific bibliometric databases. Most notable among those is PubMed, run by the US National Centre for Biotechnology Information, part of the US National Institute for Health
Scopus vs WoS
The most important factor influencing a choice between Scopus and WoS is coverage. Pranckuté (2021) reviews the studies that have investigated the coverage. The overall conclusion is that Scopus has wider coverage overall. Both are biased towards sciences, medicine and engineering and away from humanities and social sciences (though, overall Scopus is better than WoS on those fields).
It is possible to unify the two through a process known as “wrangling” (Kumpulainen and Seppänen (2022)) but the differences are unlikely to be significant enough to warrant this complex task.
2 Using bibliometric analysis
Tables of publications counts 2014-2021
The tables below are drawn from CWTS data for the years 2014 to 2021, covering the seven New Zealand universities included in the Leiden ranking.

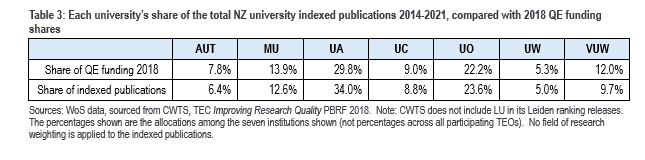
The PBRF rules don’t allocate funding equally between fields of research, with some fields weighted at 1, some at 2, some at 2.5. Applying those weightings to the data in Table 2 marginally reduces the strength of the correlation (from 0.993 to 0.990).
The analysis used in the articles uses an eight-year time period for the count of publications straddling the 2018 QE. It may be more appropriate to use the eight-year period ending in December 2017. That, too, shows a close correlation – 0.990. See Table 4.
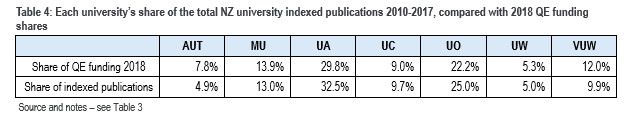
In the earlier time period, use of field of research weightings also fractionally reduces the strength of the correlation (0.990 to 0.987).
The main differences between Tables 3 and 4 are:
- The later time period benefits AUT more – as one might expect of an institution that is building its research presence.
- In the earlier time period, Canterbury, like Auckland and Otago, has a larger share of indexed publications than of the 2018 QE funding (but the difference is small, less than one percentage point).
- There are more and larger outliers in Table 4. Therefore, when we simulate the funding shifts, the earlier time series shifts more money than the later time series ($9.02 million as opposed to $8.19 Million)
Simulating the 2018 PBRF …
The 2018 QE allocated QE funding $294.494 million among the seven largest PBRF recipients. The shares of the funding received by those seven institutions are set out in Table 5 below, while Table 6 shows the effect of replacing the QE allocations with the (unnormalised) Web of Science shares, using an equal split between WoS, RDC and ERI, rather than the 55/25/20 split.


Table 6 sees a total funding shift of 2.78% or $8.19 million.
Normalising the publications counts by field of research
Different disciplines have different publication conventions. Also, bibliometric databases like the Web of Science have a bias in their coverage of journals; they tend to have better coverage of science and poorer coverage of HASS subjects – see above.
Therefore, we have applied a (crude) normalisation by the five broad fields of research displayed by Leiden University CWTS in its presentation of WoS data. The normalisation is crude because each of these broad fields summarises a large number of sub-fields; when CWTS does its normalisations (for instance of citations), they do a much more disaggregated analysis – see this page.
Table 7 sets out the normalisation approach, while Table 8 applies the normalisation to the data in Table 1. Table 9 then applies those shares to the funding simulation – as in Table 6. Table 10 gives a summary of the effects of a number of the options tried.
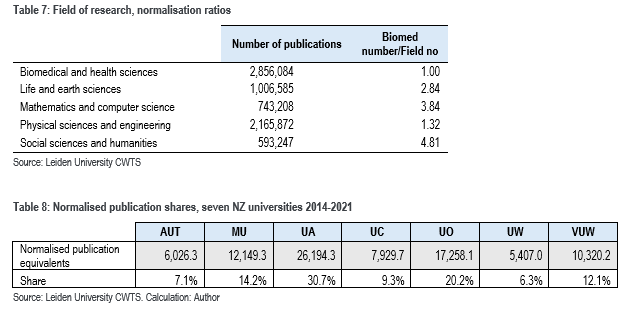

Note that the second simulation leads to a 1.89% ($5.56 million) shift in funding.
3 Allocating shares using other measures of scale
We simulated the change with five non-research-related distributions, three related to enrolments, one on staffing and one on revenue. The \shares generated by each are set out in Table 11.

Endnotes
[1] Refer to Smyth (2023) Much ado about not very much
[2] See Pranckute (2021) Web of Science (WoS) and Scopus: the titans of bibliographic information in today’s academic world
[3] This project was completed in collaboration with researchers from Curtin University, Perth. Simulations with Australian university data shows similar patterns (if not values) as WoS. However, the main drawback is that most of the world’s top journals (such as Science and Nature) are not open access. Despite that, results from the open access CWTS bibliometric data appear to be broadly consistent with results from the WoS.
