This appendix provides the quantitative analysis that underpins the paper Much ado about not very much. It contains three parts:
- The first compares at the relationship between the Research and the Citations measures in the 2023 (old methodology) THE release and between the Research Environment and Research Quality measures in the latest (2024) release.
- The second uses data from Leiden University’s CWTS analysis to explore the difference between total and fractional counting on AUT’s research performance measures.
- The third part compares the 2024 release of THE rankings of NZ universities with the most recent results of the Shanghai and QS rankings, to establish how well the new THE methodology aligns with other systems of ranking.
Part 1: The relationship between measures of research performance in THE rankings releases in 2023 and 2024
Looking across all 1,500 institutions ranked by THE in its 2020 release, Holmes (2021) found moderate correlation between the Citations and Research measures (0.59). However, confining the analysis to the top 200 universities, the correlation broke down. The correlation coefficient between Citations and Research was 0.06, while between Citations and overall score, it was a mere 0.39 – despite the fact that 30% of the overall score came from the Citations score.
Figure 1 looks at the relationship between the 45 Australasian universities ranked by THE.
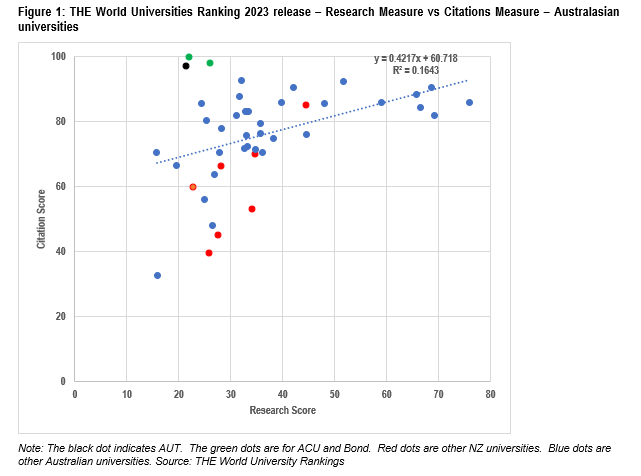
Figure 2 shows moderate correlation between the two measures – 0.41. The three strongest performers on Citations – AUT, Bond and ACU – are all outliers, coming in well below the median in Research.
That prompts us to look at how THE’s two redesigned measures were correlated in the 2024 release. Figure 2 repeats the analysis in Figure 1 for the new measures.
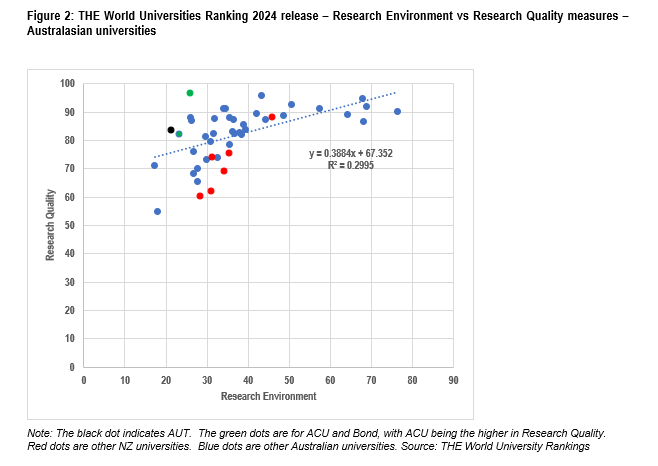
The correlation coefficient in Figure 2 is 0.55. Removing the three outliers, AUT, ACU and Bond, fives a stronger correlation – 0.63.
Part 2: Measuring research performance at AUT – fractional and total
Total counts and fractional counts are both valid measures of research output, but they are different. Total counts of citations provide a measure of two aspects of an institution’s research – the extent to which papers authored and co-authored in the institution are cited and hence, have academic impact. It also takes account of the extent to which researchers in the institution have collaborated with colleagues in other institutions. By contrast, the fractional counting method provides a focus solely on the contribution of each institution.
Because rankings are designed to focus on the performance of universities, fractional counting is usually seen as providing a truer measure of the academic impact of the research at an institutional level.
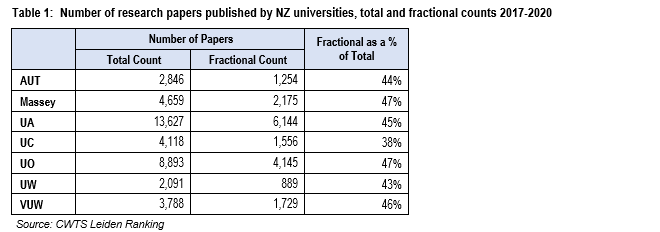
Total and fractional counts of the output of NZ universities
Leiden University’s CWTS data gives the total number of publications with total counts and fractional counts. This shows that AUT researchers’ share of papers with collaborators in other universities is similar to other NZ universities.
But AUT academics are very likely – more so than other NZ universities – to have co-authored its highly cited papers with researchers from other universities. Table 2 gives the number of cites with total counts and fractional counts, both normalised for field of research and not normalised.

AUT has a very low ratio of fractional citation count to total citation count – both normalised and unnormalised.
Mean Normalised Citation Score
CWTS calculates a Mean Normalised Citation Score (MNCS) for each paper; it calculates the mean number of citations for all the papers in the given field for a given year of publication; each paper’s citation count is expressed as a fraction of the mean number of citations for all papers in that field of research which appeared in that year; a citation count of 1.2 means that the paper has been cited 1.2 times as often as the mean for that year and field. MNCS is a reliable and standard measure of citations performance.
The MNCS for the university is the mean of the normalised citation counts of all its indexed papers. The MNCS is available for the whole institution (ie for all fields of research), and within each institution for five major fields of research[1] (which are aggregations of the 4,000+ micro-fields of research). MNCS can be calculated using total counts as well as fractional counts.
It is AUT’s very low ratio of fractional count MNCS to total count MNCS that leads to the very high ranking of AUT on total MNCS, but its middling rank on fractional MNCS. This is shown in both Figure 3 and Table 3.

AUT’s total count MNCS places it first among the NZ universities. But on fractional count, AUT comes in fifth, behind Auckland, and at the tail of a cluster that also includes Otago, Waikato and Victoria[2].
Figure 3: CWTS Leiden 2022 release – Mean Normalised Citations Score, Total Count vs Fractional Count – NZ universities
That result implies that many of AUT’s most highly cited papers were collaborations between AUT researchers and researchers in other universities.
What is significant is the extremely high value of AUT’s total MNCS in Biomedical and health sciences (2.3) meaning that those papers are extremely highly cited – 2.3 times as much as the mean paper in the field. However, the very low ratio of fractional to total MNCS for AUT in that field (54%) shows that almost half of the credit for those high citations flows to collaborators in other universities. This is the primary driver of the discrepancy between AUT’s overall fractional and total MNCS.

Much of this difference is the Feigin effect.
Comparing CWTS and citations measure used in the 2023 THE release
Analysis of the relationship between the 2023 THE Citations measure and MNCS among NZ universities shows high correlation[3]. The correlation coefficient between the fractional count MNCS and the THE measure is 0.73 – a strong correlation. With the total count MNCS, it is 0.95 – an extremely high correlation. See Figure 4 below.

Looking at the relationship across Australian universities shows similar strong correlation, with the MNCS total count having a stronger correlation than the fractional MNCS. The correlation coefficients are 0.83 and 0.72 respectively.
Figure 5 below looks at the relationship between the two measures of citations performance – the THE and the MNCS Total Count score across the 40 Australasian universities that participate in both ranking systems. The MNCS Total Count explains 75% of the variation in THE scores among the Australasian universities.

That analysis shows that THE’s former citations measure produces a distribution that echoes the total count MNCS, at least in Australasian universities. However, total count is not a pure measure of a university’s research impact – it breaks down where a high proportion of a university’s citations are from papers co-authored in other institutions (Australian Catholic University, the University of Canberra and AUT are examples). A true measure of the academic impact of a university’s research papers would be from the CWTS MNCS fractional count reading.
Part 3: The relationship between the 2024 THE ranking of NZ universities and other ranking systems
One of the reasons critics focused on the THE rankings – and the citations measure in particular – is that it produced results so different from other established popular ranking systems. It raised the question – who is more “right”, who is more “wrong” among the rankers. Marginson (2014) and Gadd et al (2021) both express doubts about the validity of the THE ranking, even more than some of the other popular rankings.
So how has the methodology change from the 2023 release to the 2024 release affected the alignment of the THE ranking against the QS and Shanghai rankings. Note that the Shanghai ranking is based solely on objective measures and largely uses research measures while the QS (like THE) attempts to take a broader view of performance and includes surveys as a source of information.
Table 5 looks at the results for the NZ universities of the latest QS and Shanghai against the old methodology (2023) and new methodology (2024) releases.
Note that the Shanghai ranking takes little account of performance – they mostly look at bulk measures without reference to the scale of institutions. However 10% of their score comes from what they call “per capita performance” (PCP) which takes the results of all their other measures and scales it according to institutional size. Table 5 includes both the overall and the PCP rankings.
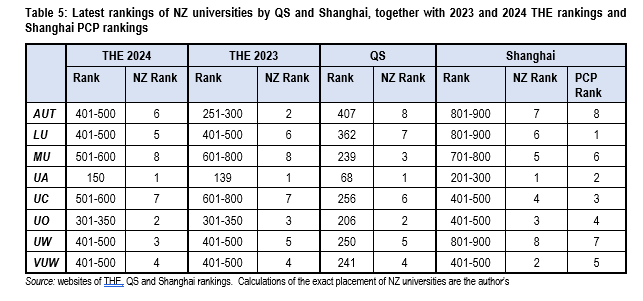
The new THE ratings are more consistent with the others in the cases of AUT, LU, UA, UO and VUW. UC and MU are seen more favourably by Shanghai, while UW is less so. On the Shanghai PCP rating, the main shifts are the LU (which is tiny) gets a boost. Note that the NZ university rankings in Shanghai and THE in Table 5 have been calculated from the component scores recorded for each university and then combined into a final score using the weightings in the rankers’ methodology. These are “unofficial” rankings – as the ranking systems present most universities’ rankings in bands. Caution is needed here: combining imprecise measures in the way that rankings do to calculate a numeric score risks lending a spurious accuracy to the sco
Endnotes
[1] Biomedical and health sciences; Life and earth sciences; Mathematics and computer science; Physical sciences and engineering; and Social sciences and humanities.
[2] Note that, on the fractional count, there is little difference between AUT, Otago, Waikato and Victoria – all are close to the international mean score of 1.0. That pattern has been consistent over the last three counting windows – Auckland is first, Massey and Canterbury are at the lower end and AUT, Otago, Waikato and Victoria make up a cluster in the centre, around the international mean of 1.0.
[3] One of the complexities of the THE measure of citations is the regional/country adjustment. As far as is known, it is applied uniformly across each country’s universities. Therefore, it should make no difference when we confine our analysis to the NZ universities. Given that Australia is likely to have greater national research impact than NZ, it is likely that it would have the effect of (slightly) depressing the THE Citations scores of Australian universities in a trans-Tasman analysis.
