
Disparities in tertiary educational performance …
We all know that there are disparities by ethnic group in tertiary education performance. And that this is something that the government (the TEC in particular) wants providers to address. The graph below shows the 2022 data for bachelors students in three educational performance indicators – qualification completion rates (QCR), Year 1 retention (Y1R) and course completion rates (CCR).

The message is stark; Māori and Pacific students do not perform at the same level as those of other ethnicities. Pacific students especially.
Over the last six or so years, the TEC has tried to shift the disparity by setting expectations of parity between the performance of different ethnic groups on individual providers through investment plan approvals. But the disparities haven’t shifted. In fact, for Pacific students, the disparity grew slightly between 2016 and 2022, while for Māori, there has been a marginal narrowing of the gap in two of the three measures shown in Figure 1.
The persistence of disparity is not because providers don’t want to fix it. No provider wants disparities. But the drivers of disparity run deep, reflecting historical and structural divisions between groups in our society. So shifts are hard to achieve; parity looks as far away as ever. And, when no institution has managed to meet the expectations, the TEC has not applied any sanctions; it’s not possible to punish the whole system! Instead. the TEC engaged in dialogue with institutions and clarified expectations.
So TEC has rethought its approach…
That led the TEC to shift its approach to recognise the challenges faced by providers in dealing with these problems.
TEC has created its Ōritetanga Learner Success directorate to lead its work on disparity and equity. That has led to a more constructive stance, trying to focus providers on the challenges of disparity and to help providers’ work to address this issue. The TEC has encouraged providers to share their experiences and practice in addressing disparity. TEC hosted seminars at which managers from Georgia State University explained how they turned around learner success, using learning analytics to provide targeted help to students assessed as at risk of failing. GSU, an institution that caters for historically disadvantaged groups, with a large Afro-American intake, has been remarkably successful in lifting graduation rates through rapid, personalised interventions when a student’s behaviour – such as missing a deadline or an assessment – indicates risk of failure. Interventions like learning support. Like help managing university processes. Like encouragement. Personalised support, focused on the particular risk facing the learner, mostly one on one. All backed by a comprehensive analysis of masses of micro-data from GSU’s student management system and its learning management system. It’s a tremendous story; if you haven’t checked out what they do and how, you should[1]. It’s an inspiring example (even if the context is quite different to ours).
The TEC has also hosted seminars to facilitate the exchange of ideas and experience among providers. And there has been money for learner success pilots, with a further new fund to help providers meet the costs of learner support initiatives, but leaving each provider free to tailor its work to its own students, processes and information infrastructure.
And, in another step forward, the TEC has asked providers to focus on what they can change in their own practice to support students better and to put students at the centre of their work. As part of that, they have asked providers to develop success plans that set out in a concrete way what steps they intend to take to address disparity. Learner success plans are a mechanism to help an institution develop and strengthen its support for students at risk of failure.
And the TEC has asked each institution to name the date by which it will achieve parity. That’s a big step forward from the initial practice of imposing a date, necessarily an arbitrary date, the same date for all providers, irrespective of individual provider circumstances and focus. This new approach is altogether more enlightened, more likely to succeed.
But it’s not straightforward …
So far, not all providers have been prepared to name a target parity date. The vice-chancellor of AUT, Damon Salesa, told RNZ that “… disparities in education have origins outside of education. They come from disadvantages that whānau have in their homes and their working lives, intergenerational poverty, the effects of … [the] compulsory sector …” He noted that AUT enrols more students from disadvantaged backgrounds than other universities, that AUT was determined to improve Māori and Pacific student success and to reduce disparity. He wasn’t seeking to shirk accountability for his students’ performance but, rather, he recognised the breadth and complexity of the risk factors AUT’s students arrived with when they entered study; that complexity meant that the task of setting a realistic and achievable deadline for the elimination of disparities would take time.
Likewise the University of Waikato expects that its learner success initiatives will lead to ‘… radical improvements in … pass rates, the graduation rate, and [will] help close the parity gaps …” But Waikato told RNZ that it is not in a “…in a position to set a realistic target [date] for achieving parity…”
But the University of Canterbury deputy vice-chancellor, Catherine Moran, told RNZ that her university has introduced a set of learner success initiatives that are identifying barriers to achievement and that are already showing signs of reducing disparities in EPIs. She was optimistic that gaps could be closed by 2030.
Likewise, Massey expects to halve disparities by 2026 and to eliminate them by 2030 – an ambitious target given the diversity of Massey’s student body[2].
In effect, the difference between the position of Massey and Canterbury and the view of AUT and Waikato is about whether, and how much, a university can be an agent for elimination of inequities embedded in our society, generated elsewhere in our social fabric – in people’s experiences in early childhood, in preschool education and in the compulsory education system, in housing and social conditions more generally. We know from the research of Nobel prize-winning economist James Heckman[3] that educational gaps between individuals and across socioeconomic groups appear at an early age, for both cognitive and socio-emotional skills; Heckman argues that, as children progress through school, gaps become entrenched or grow; after the second year of primary education, schooling tends to play only a minor role in reducing educational gaps[4].
Of course, Heckman is looking at the gaps across the whole population. But, for young people who have met the requirement for entrance to university and who have chosen to enrol in a university, the achievement/skills gap is narrower. AUT and Waikato are saying that they can help reduce that gap, but they are asking whether it is reasonable to expect a university to eliminate it altogether. On the other hand, Catherine Moran is arguing that the learner success initiatives Canterbury is implementing should eliminate gaps, in the same way that GSU has lifted the graduation rate of its Afro-American students and eliminated the gap between the graduation rate of Afro-American students and the student body overall[5].
Both sides view their institutions as agents of social change; both believe they can help mitigate embedded disadvantage. Waikato and AUT, the two universities with the greatest concentration of Māori and Pacific students[6], are more cautious, however, while Canterbury is confident that its learner success plan will deliver parity within seven years.
Who’s right?
Let’s look at what we know about the factors that influence achievement in tertiary education, to assess the extent to which it is ethnicity that is driving the disparities in achievement between ethnic groups.
In this article, I look at the evidence for how being of Māori or Pacific ethnicity affects enrolment and achievement in tertiary education and make suggestions on how institutions (and the TEC) might measure progress towards greater equity (and ultimately, parity) of educational performance.
Because the disagreement on target setting has arisen primarily in the universities, most of the discussion below relates to bachelors degrees and to universities. That serves to illustrate the points at stake and simplifies the presentation. But the discussion could equally be applied at other qualification levels
What the data show
In 2018, Ministry of Education researcher David Earle undertook a statistical study to explore what factors signalled the risk of low participation and achievement by young people in tertiary education. Using data from Statistics NZ’s Integrated Data Infrastructure (IDI), Earle was able to take account of demographic factors (such as ethnicity and gender), family and neighbourhood factors (like parental education, socio-economic deprivation, parents’ mental health, parents’ contact with the justice system), school education performance and school achievement[7], behaviour at school (for instance, being stood down, number of secondary schools attended), health factors … more than can be listed here. He checked out which factors had a statistically significant effect on participation and achievement at different qualification levels[8].
This means that if (say) course completion rates among Māori students are lower than among European-Pākehā students, we can check out how much of that difference relates to differences in the school performance of the students. In other words, we can identify the influence of ethnicity on the performance by applying a statistical control on the range of factors.
Let’s look just at what factors are associated with the likelihood of enrolling at bachelors level and at the three EPIs listed above – course completion, retention beyond year 1 and qualification completion[9].
Participation
For young people who manage to get UE, the most important factors associated with moving to bachelors study are:
- the level of school performance[10]
- parents’ highest education level
- the levels of deprivation of the neighbourhood student was raised in – a measure of socio-economic status (SES)[11].
Young people with a parent with a bachelors degree or higher were 1.5 times as likely to undertake bachelors study as a young person whose parents had no qualifications. A young person from a low deprivation (ie, high SES) neighbourhood was 1.45 times as likely to enrol in bachelors as a young person from a high deprivation area.
Being of Asian ethnicity was associated with a higher probability of enrolling at bachelors level, even after we control for school performance, parental education and SES. However, Māori or Pacific ethnicity was not a statistically significant factor. That’s not to say that Māori and Pacific young people have high bachelors participation rates – Figure 2 gives the lie to that.
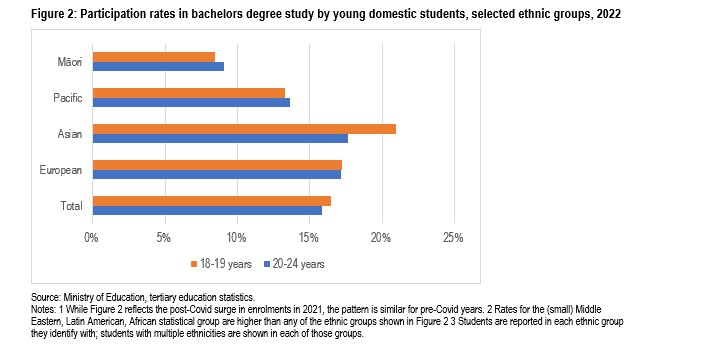
Rather, Earle’s findings suggest that the participation disparity between Māori and Pacific students and other students is mostly associated with some combination of lower school performance, lower educational attainment by parents and a higher probability of having been raised in a low SES neighbourhood. That is, not with their ethnicity per se.
A similar sort of analysis by the Productivity Commission in 2017[12] also identified school performance, SES and parental education as the key drivers of participation in a bachelors degree. That study also identifies the characteristics of the school attended and behaviour at school[13] as significant factors in the participation decision. The researchers found that individual, family and school factors explain 87% of the gap between Māori and European-Pākehā participation at bachelors level, but that Pacific students have a higher propensity to take bachelors study than the European-Pākehā group, controlling for all observable factors. In other words, ethnicity plays a part in the low participation rate of Māori, compared with European-Pākehā, but is not a factor with Pacific young people.
Both the Earle study and the Productivity Commission study show that, regardless of ethnicity, the largest contributor to bachelors participation gaps is school performance. So, if ethnicity appears not to be a factor in participation at bachelors level for Pacific school leavers and a relatively minor factor for Māori, how does this play out when we look at achievement among bachelors students?
Passing courses
Earle’s study assesses the factors associated with students passing “most” (ie 85% or more) of the courses taken in the first year of study.
The most important factor associated with passing most year 1 courses by young bachelors students is the level of performance at school. Those with high NCEA Level 1 performance were more than 3 times as likely to pass most courses as those with low performance. In addition, being of Māori or Pacific ethnicity is associated with a risk of not passing most year 1 courses, even after controlling for school performance and other factors. This factor is statistically significant (but the effect size is smaller than the effect of school performance). The risk is higher for Pacific students is than it is for Māori.
The other significant factor associated with passing most first year courses is having had treatment for a mental health condition during the first year[14].
Retention beyond year 1
Earle finds that the three factors significantly associated with first year retention by young students in bachelors degrees are, in order of importance they:
- having passed 85% or more of first year courses
- level of performance at school
- having had mental health treatment during year 1.
Ethnicity is not a significant factor; Figure 1 above shows low retention by Pacific bachelors students, compared with those who are non-Māori and non-Pacific. Māori bachelors students have even lower retention into a second year. However, Earle’s model suggests that the gap largely reflects lower performance by Māori and Pacific students in the passing courses measure and the lower school performance.
The Productivity Commission’s analysis of first year retention didn’t take account of school performance. Their finding is that passing courses in year 1 of the bachelors study is the key driver of retention beyond the first year for all ethnic groups. For Māori, that (and other observable factors) doesn’t explain all of the gap in retention, so that some factors outside the variables in the model, factors that may be specific to Māori do play a part. But Pacific students have a higher propensity to remain in their bachelors study than the European-Pākehā group, controlling for factors like first year pass rate.
Gaining qualifications
Earle’s model shows that the factors significantly associated with qualification completion within six years by young students in bachelors degrees are (in order of effect size):
- having passed 85% or more of year 1 courses
- level of performance at school
- gender, with young women being more likely to complete than young men
- being of Pacific ethnicity
- SES – ie, being raised in an area of high deprivation
- being of Māori ethnicity
- having changed secondary school.
Both Earle’s analysis and the Productivity Commission study agree that students of Pacific and Māori ethnicity are significantly less likely to complete a bachelors degree within six years than those who are non-Māori, non-Pacific, even controlling for other factors. And they conclude that the effect is stronger in the case of Pacific students.
Academic preparedness and success in bachelors study
During 2018, Universities NZ synthesised findings from its members on factors that predict success in university study. The universities had constructed an “academic preparedness score” based on the performance of a student in NCEA Level 3. That score was found to be very highly correlated with first year bachelors grade point average (GPA). While Māori and Pacific students have lower GPAs on average than European-Pākehā students, the difference was found to be largely attributable to the difference in academic preparedness. Among those with high academic preparedness scores, the difference between ethnic groups is slight; a low academic preparedness score was found to be a particular risk factor for Māori and Pacific students.
What we can conclude
First and most important, much, if not all, of the disadvantage experienced by young bachelors students of Pacific and Māori ethnicity is attributable to factors unrelated to experiences in tertiary education, factors that students bring with them when they first enter tertiary education – such as their schooling, parents’ education, SES[15]. Exactly as Damon Salesa told RNZ in the comment quoted earlier. And, if we were to use IDI data to dig into the factors associated with school performance, we would expect to see that family factors like parental education and SES would be driving that.
That all helps explain the fact that the challenge of achieving parity has been so intractable. Recall Heckman’s finding – the later a learning intervention occurs, the more costly and the less likely to succeed[16]. It’s difficult for a tertiary institution to unwind effects that have their causes in circumstances that are rooted in a past that can’t be undone.
Further, statistical models like those developed by the Productivity Commission researchers and by David Earle explain only part of the variance in performance. Decisions about whether to study and students’ performance in study are influenced by a range of factors which are not captured in data; for instance, things like socio-emotional skills undoubtedly play a part in influencing performance. That, too, helps explain the persistence of disparity[17].
Institutions recognise that they need to take actions to minimise the risk of failure and attrition among Māori and Pacific students (through interventions like culturally-appropriate support early in students’ time in study, learning support programmes and pastoral care) but undoing embedded disadvantage is never going to be easy.
Equity, Parity
Remember, this discussion arose from the reluctance of two universities to nominate a date by which their learner success plans will lead to the elimination of disparity.
One of the important features of the tension between AUT and Waikato on the one hand and Canterbury and the TEC on the other is that institutions are expected to achieve parity, not just equity.
Equity in education means everyone should be given the same opportunities to succeed, regardless of their SES, ethnicity, gender, …. or any other characteristic. A system is equitable if it addresses and compensates for systemic inequalities that have disadvantaged certain groups. An intervention is equitable if it creates fairness, a level playing field for everyone, for all groups.
Parity goes a step further. Parity in an education measure means that disadvantaged groups have achieved the state of equality or equivalence in the measure. Whereas equity is focused on opportunity and on the way processes and systems work, examining parity entails looking at the results of the processes and systems, checking whether the processes and systems have delivered results that are equivalent for all the groups we focus on.
Parity is a higher bar. Perhaps, in seeking parity as the mark of success, the TEC has reasoned that parity is the one true test of equity. Parity is what six universities have signed up to. AUT and Waikato clearly take the issue seriously. But their anxiety is understandable; they can control their systems and processes – that’s bringing the horse to water. Quenching the thirst is harder to control. For a university that is serious in its commitments and its responsibilities to its communities, this is a very high stakes test.
Setting expectations
Essentially, the TEC Ōritetanga approach to achieving parity has been to encourage providers to take greater responsibility for their students’ success by providing better support. The approach is flexible, recognising that each provider has a distinct profile; each student body has its own characteristics, so a blunt set of uniform measures wouldn’t work – so the timeframes for achieving parity and some of the approaches to measuring progress are left to individual providers to propose.
Where to from here
Ōritetanga is among the very best things that the TEC has done in the two decades of its existence. This programme is focused on an area where the TEC can really add value in Its management of the system.
The Ōritetanga programme needs to retain the learner success plans, retain and build on the information dissemination work and facilitating the sharing of best practice. It needs to maintain its work in promoting the take up of more sophisticated learning analytics to help institutions understand how individuals are learning, to identify the risks to achievement and to underpin learning support interventions. It might also consider how it can use the professional development capability of Ako Aotearoa.
However, despite the flexibility of the new Ōritetanga approach, despite the readiness of institutions to take accountability for learner success (even while recognising that most of the drivers are outside institutional control), despite (in the case of universities) that nearly all young students will have achieved at least the UE standard before enrolling, despite the power of learner analytics to fuel more effective learning support interventions, despite the importance of parity as a means of discharging the system’s Tiriti commitments, despite the importance of equitable outcomes to the future of our social and economic fabric …. despite all that and more, achieving parity of outcomes remains a very big ask. There is a risk that some institutions, despite their willingness, despite having equitable processes and systems, and despite their work on learner success, fail to deliver parity[18].
Perhaps one way forward might be a refinement of the measurement approach in the TEC’s Ōritetanga programme. Staging the targets and applying more statistical controls to the measures would allow us all to recognise the equity-related work of institutions, even those that struggle to (or even, fail to) achieve parity.
So let’s think about the measurement approach and the target setting.
Research what determines learner success
The two statistical studies that I have drawn on above used Statistics NZ’s IDI to explore factors that are significantly associated with learner success and then they have decomposed the findings to explore ethnic differences. Those were pioneering works, conducted at a time when the IDI was still in formation. The IDI is now a fuller, more complete, better understood resource. The IDI dataset needs to be explored afresh to see if there are other factors that should be included in the indicators of progress to parity. In particular, having survey data and the Census now available in the IDI may open out new avenues to explore.
So my advice is: Commission more and deeper analysis of, and research on, the factors that influence student success. Use the results to shape more and better measures.
Use measures that really matter
Much of the emphasis in monitoring the move towards parity is on a set of educational performance indicators (EPIs) developed by the TEC in 2009 as part of its monitoring of tertiary education organisation performance – course completion rates, first year retention rates, qualification completion rates[19]. These measures have limits.
The first and most important issue is that they are calculated and presented without statistical controls. It is clear from the discussion above that school performance drives first year course completions which drives retention which influences qualification completion. We would get a better sense of performance if we were to control for a measure of course completion for students’ academic preparedness. Certainly that would mean that we could assess how well an institution was ensuring that (say) Māori student course completion performance was, compared with the performance of Pacific students and European-Pākehā students of similar academic readiness[20]. This would also allow us to gain a measure of the value added by the institution for each of the priority groups. It would give a more precise readout of the progress towards reducing gaps. So control course completion rates for prior academic performance.
Second, the TEC has a particular focus on qualification completion, rather than course completion. That is because it is gaining a qualification that makes most difference to labour market outcomes for young people[21]. However, there are many students – for instance, older students already in the workforce – for whom qualification completion is not an aim. Likewise the presence of large numbers of part-time students will inevitably distort our view of the institution’s performance as many part-timers will gain their required/desired outcome without completing a qualification or else they may take many, many years to complete; their performance should not be included in this measure[22].
An assessment of parity using a measure of qualification completion risks distortion, because an institution whose priority students are disproportionately part-time or from an older age group will find it harder to achieve parity than an institution with a primary focus on young students. In other words, applying a qualification completion measure to older (ie non-core-age) and part-time students clouds the picture. This measure should be applied solely to core-age, full-time students.
Third, we have seen that in one of the measures – first year retention – ethnicity is not a significant factor. What is more, retention beyond year 1 is almost entirely driven by course completion; there is collinearity between these two measures. Retaining this measure alongside course completion rates means that when students fail courses, there is a kind of double jeopardy for the institutions’ EPIs. Drop first year retention as an EPI
Fourth: we should use the results of the research discussed above to look for other possible statistical controls on the core EPI measures – for instance, would it make sense to use a control for SES for younger students? For geographic measures (such as metropolitan/urban/rural, for instance)? How should we deal with disability in the measures?
So my advice is: Redesign the core EPI measures:
- Drop the retention measure
- Apply a qualification completion rate measure only to full-time, core-age students
- Apply statistical controls to the course completion rate measure
- Identify other variables that should be factored into the design of measures.
Explicitly measure progress towards parity
In the Ōritetanga programme institutions are setting parity achievement dates well into the future. We all presume that each institution is reporting progress over that time to the TEC and discussing obstacles and progress, as well as sharing their approaches with other like institutions.
However, there would be value in institutions identifying a set of progress measures for reporting annually, in a transparent way. Not progress targets, but a set of measures that allows the institution, the TEC and the wider sector, to see how the institution is performing – over time and against historic norms – in progressing towards parity. That is especially important in my view because of the fact that parity is a seriously difficult target, because there is a risk that an institution may make enormous progress in reducing disparity but reach the target date without hitting parity, because when the dialogue between the institution and the TEC is entirely private, there is a high risk of cynicism among stakeholders. Institutions should be acknowledged and congratulated for their commitment and their progress, even if they can’t reach the magic end point on the due date.
In these progress measures, it would be useful to see quantification of the historic differences in performance between ethnicities and against historic system norms, for instance, between low, medium and high SES students. Certificate/diploma students vs bachelors students. Older students vs core age students. Among core-age students, those who enter tertiary education with low, medium or high secondary school achievement.
Achieving parity in each of these subgroups might provide intermediate targets, steps on the way to the ultimate goal, useful in institutional management as well as helping the TEC to map progress towards parity (and thus, to help target their support for the sector). Providers would be able to understand where they are succeeding in progress to parity and where they aren’t.
So my advice is: Each institution should develop a set of progress measures to enable the institution (and the TEC) to monitor progress towards parity by reporting on progress towards ethnic parity in major subgroups of the student body – such as by prior educational performance, by SES, by qualification type, by metropolitan/urban/rural ….
Yes of course, I know that there will be practical analytical problems. And that any analysis using the IDI is subject to data lags and limits on the ability to bring out the data on small groups. And that some providers may struggle to establish the SES for their students. Of course there will be practical problems. But problems exist to be solved.
An afterthought
In Aotearoa New Zealand, we mostly conceive of equity (and thus, parity) primarily in ethnic terms. That’s understandable because in our society, disadvantage – in most social policy domains, whatever its origins – is experienced most acutely by Māori and Pacific peoples.
Those who have followed the ongoing discussion in Australia of the Australian Universities Accord review will be aware that in that country, too, there is much current discussion of equity and parity. But with differences. In the Accord interim report, there is a focus on four main “equity groups” – low SES students, regional/remote students, those with a disability and indigenous Australian students[23]. The Accord report discusses parity of participation and parity of attainment (meaning achievement of a qualification).
Three points of difference are instructive ….
- The Accord discussion sees parity as a goal for the system, without (at this stage anyway) suggesting that there should be uniformity of targets at each institution (such as we have here).
- Parity of participation doesn’t magically lead to parity of qualification attainment; so, at some point, there may need to be a focus on what institutions do to convert participants to graduates.
- The fact that social disadvantage is so acute in Māori and Pacific peoples in Aotearoa NZ means that we may be at risk of losing sight of other sources of disadvantage – rural populations, low SES groups, for instance – except in as much as they include Māori and Pacific.
References
Carneiro P, Cunha F and Heckman J (2003) Interpreting the evidence of family influence on child development Research Gate
Crichton S and Dixon S (2011) The labour market returns to further education for working adults Department of Labour
Cunha F and Heckman J (2007) The technology of skill formationNBER Working Paper No 12840 National Bureau of Economic Research
Earle D (2018a) Factors associated with achievement in tertiary education up to age 20Ministry of Education
Earle (2018b)Factors associated with participation in tertiary education by age 20 Ministry of Education
GSU (2021) Student Success Programs Georgia State University
GSU (2018), 2018 Status Report – Complete College Georgia Georgia State University
Heckman J (2011) The economics of inequality: the value of early childhood education American Educator, Spring 2011
Kautz T, Heckman J, Diris R, ter Weel B and Borghans L (2015)Fostering and measuring skills: improving cognitive and non-cognitive skills to promote lifetime successOECD Publishing
Meehan L, Pushton Z and Pacheo G (2017) Explaining ethnic disparities in bachelor’s qualifications: participation, retention and completion in NZ NZ Productivity Commission
Norton A (2023) The Accord equity target that cannot, and perhaps should not, be achieved Higher Education Commentary from Carlton
O’Kane M et al (2023) Australian Universities Accord Interim Report Department of Education
Scott D (2009) What do students earn after their tertiary education Ministry of Education and Statistics NZ
Other sources:
Australian Universities Accord
Ministry of Education, Education Counts, Tertiary Education Statistics
Radio NZ, News report on parity targets
Tertiary Education Commission, Educational performance using interactive charts
Tertiary Education Commission, Ōritetanga Learner Success
Endnotes
[1] See, for instance: GSU (2018). 2018 Status Report – Complete College Georgia. or GSU (2021) Student Success Programs,
[2] Massey has an unusually high proportion of older students, part-time students and distance students – three groups that, historically, have had lower pass rates. See the data here.
[3] See, for instance: Carneiro, Cunha and Heckman (2003) Interpreting the evidence of family influence on child development, Cunha and Heckman (2007) The technology of skill formationand Kautz, Heckman, Diris, ter Weel and Borghans (2015)Fostering and measuring skills: improving cognitive and non-cognitive skills to promote lifetime success
[4] See, for instance, Heckman (2011) The economics of inequality: the value of early childhood education
[5] Refer to GSU (2018), 2018 Status Report – Complete College Georgia. In addition to eliminating the gap for Afro-Americans, GSU has eliminated the gap for Hispanic students, first generation students (often called first in family) and for students who qualify for income support through the Pell grant scheme.
[6] At Waikato, 34% of the headcount of students were Māori or Pacific in 2022. At AUT the proportion was 31%. The next highest was Massey (21%).
[7] “School performance” means how well students have acquired the achievement standards they have taken – meaning their grades (not achieved, achieved, merit and excellence) moderated by the difficulty of the standards. “Achievement” means attainment of qualifications.
[8] Refer to Earle (2018a) Factors associated with achievement in tertiary education up to age 20and Earle (2018b)Factors associated with participation in tertiary education by age 20
[9] Earle’s focus wasn’t on the measures as defined by the TEC in its EPIs. His measures were: for course completion: passed 85% of the course load. For qualification completion: completing within six years of starting. Earle’s retention measure was broadly the same as the TEC’s.
[10] Earle used students’ performance at NCEA Level 1 as a measure of school performance
[11] In Earle’s two reports, statistical significance is at the 95% confidence level.
[12] Meehan et al (2017) Explaining ethnic disparities in bachelor’s qualifications: participation, retention and completion in NZ
[13] School characteristics included single sex/co-ed, state vs private. School behaviour was proxied by the number of school notifications.
[14] Earle’s modelling shows one other statistically significant association with success in this measure – selection of field of study. In this article, I do not discuss factors relating to a student’s selection choices.
[15] Look at Norton (2023) The Accord equity target that cannot, and perhaps should not, be achieved for a discussion of the relationship between parental education and primary school performance and between SES and primary school performance.
[16] See Heckman (2011) The economics of inequality: the value of early childhood education
[17] The modelling in Earle’s 2018 reports and in the Productivity Commission’s paper relied on the IDI as it stood six years ago or more; Statistics NZ and the Social Wellbeing Agency have undertaken a great deal of development since then, so that the redoing Earle’s work would likely produce models of greater explanatory power and may well throw up additional factors.
[19] In the current discussion, we needn’t trouble ourselves with progression rates
[20] In particular, institutions could calculate the student’s NCEA “achievement score” which takes account of the difficulty of each NCEA standard, as well as the student’s score – achieved, merit, excellence.
[21] Refer to Scott (2009) What do students earn after their tertiary education. See also Crichton and Dixon (2011) The labour market returns to further education for working adults.
[22] Ministry of Education statistical data shows that students in the 25-39 age group (the age group most likely to be affected by parental responsibilities and a stage when many people are focused on building careers) have lower course completion rates. So do distance students. Older students, part-time students and distance students are also less likely to persist with study (affecting the retention EPI as well as the qualification completion EPI). (In the Ministry website linked to here, go to the Qualification completion, attrition and direct progression rates section and consult spreadsheet #7.)
[23] Though Andrew Norton asks about other possible equity groups for Australia – first in family, care leavers, people from single parent families and children of asylum seekers – which also get a mention in the Accord interim report.
