Victoria University of Wellington is considering inviting its staff to take salary reductions in response to the Covid-19 pandemic. The pandemic has increased costs. It has also led to the loss of international student revenue. The Minister of Education, Chris Hipkins, told RNZ that “… [university] enrolments are likely to go up because we know that in times of higher unemployment participation in higher education increases”. In other words, the loss of international students may be partly offset by increased numbers of domestic students.
And the universities have an opportunity to exploit New Zealand’s success in battling the virus as a means of capturing market share from the US and the UK.
To recover all the current international student revenue through domestic enrolments, universities would need to enrol an extra 30,000 full-time students, a rise of around 22%.
So, let’s look at just how sensitive enrolments are to the economic cycle.
What does drive enrolment levels
The minister’s statement reflects the common knowledge that provider-based higher education is countercyclical – when the economy thrives, enrolments fall, but a recession causes enrolments to rise. But what institutions and the government need to know is what types of enrolments are sensitive to the economic cycle, by how much, and how soon.
The Ministry of Education’s current enrolment forecast models use two main explanatory variables – the size of the youth population; and expected youth unemployment. These have been found, through exhaustive statistical testing, to be the two main drivers of changes in enrolments. The weighting of those two variables differs between levels of qualifications and consequently, between universities, polytechnics, wānanga and PTEs.
University enrolments depend on large cohorts of school leavers and on holding the great majority of those students for three or more years. As a result, their enrolments have been seen as very sensitive to changes in the size of the youth population but less sensitive to the unemployment rate. For polytechnics, the weighting is the reverse, because their enrolments have been found to be more sensitive to the economy and relatively less to the size of the youth population.
That squares with the conventional wisdom – internationally, bachelors degree enrolments are usually seen as less responsive to the cycle, whereas shorter qualifications and provider-based vocational qualifications are seen as thriving during economic downturns.
But, by definition, recessions aren’t normal times.
What does happen in a recession
As the global financial crisis (GFC) loomed in 2009, Ministry of Education economist Warren Smart undertook a statistical analysis of how enrolments in post-compulsory education had tracked the economic cycle. He focused especially on the severe recession of the early 1990s.
That analysis concluded:
- The recession of the early 1990s saw significant increases in participation in senior secondary school and in tertiary education. Participation in senior secondary school increased significantly from the mid-1980s to the peak of the recession in the early 1990s.
- There was a large increase in participation at the bachelors level during the recession. Smart found a high degree of association between participation in senior secondary school and participation in bachelors study in the following year. In other words, bachelors enrolments grew because the increase in school retention meant that there were more young people eligible to enter degree study. This indirect effect of the recession meant that there was a one-year lag between the economic shift and the change in bachelors enrolments.
- And the progression rate from bachelors to postgraduate qualifications matched changes in the unemployment rate. The early 1990s saw a strong increase in participation at the postgraduate level – presumably as graduates delayed their entry to the labour market. But this effect faded as unemployment eased.
- In the stronger labour market of the early 2000s, bachelors level study fell for older age groups.
But recessions aren’t all the same …
Each recession has different triggers, different durations, a different character. The recession of the early 1990s had three main drivers. It reflected a major reallocation of resources in the national economy, with economic liberalisation and deregulation from the late 1980s leading to closure of uneconomic industries and a move away from state-run trading. There were also recessions in our main trading partners. High real interest rates and the reductions in government spending, following the 1990 election and in the 1991 budget, further dampened demand. This confluence of factors saw unemployment reach around 10%.
In the late 1990s, there was a short, less severe downturn, caused by instability in Asian capital markets (that reduced demand for our exports) and by a drought that hit agricultural production. Unemployment rose to around 8%.
The GFC resulted from failures in the world financial and banking systems which led to major falls in asset values with consequent reductions in demand and investment. And in employment. Unemployment jumped sharply in New Zealand between 2008 and 2009, reaching 6% in 2010 and it stayed at that level until 2013.
The recession we face now – resulting from the Covid-19 pandemic – is different again. Lockdowns had an immediate, sharp effect on demand across the economy. Trade was disrupted. Major industries like tourism and hospitality are likely to experience protracted loss of business. Firms will fail. There will be reductions in asset prices and wealth. Demand collapsed fast, but will recover slowly. Unemployment is already rising, more quickly than in the GFC.
But what all recessions have in common is that they all affect the labour market, hitting young people especially hard. And they have a flow-on to the education system.
So what happened during and after the GFC
Warren Smart’s excellent analysis appeared in June 2009, just as New Zealand was experiencing a large increase in unemployment and working on its response to the GFC. To work out the relationship between the shifts in the economy and the changes in enrolment as the GFC played out, I have applied some of Smart’s analytical approach to data from 2008, picking up where he left off.
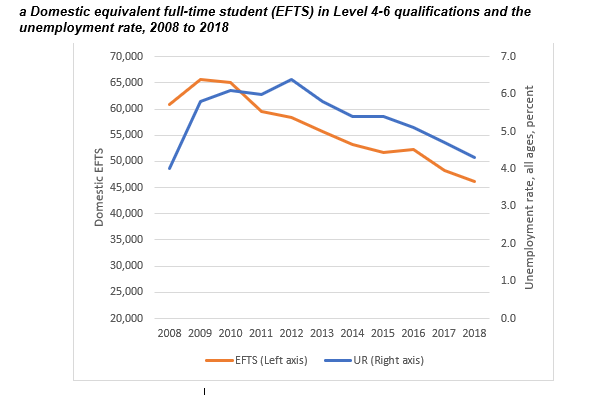
Bachelors degrees
Figure 1: The relation between enrolment in bachelors degrees and the unemployment rate through the GFC and beyond

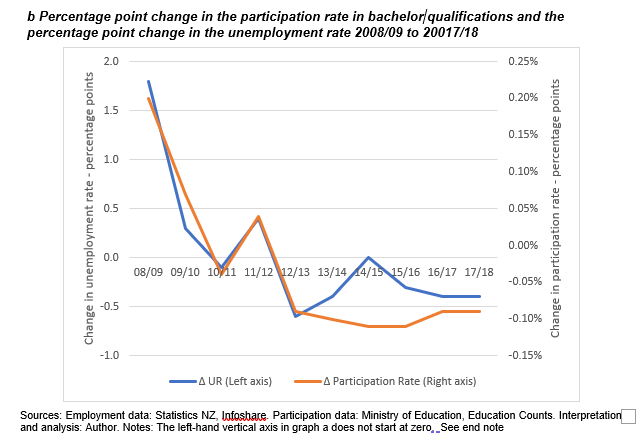
Figure 1 shows a close relationship between bachelors enrolments and the unemployment rate between 2008 and 2013. The change in the participation rate tracks the change in the unemployment rate very closely over that time. There is no sign of the one-year lag between changes in unemployment and enrolment levels in bachelors degrees observed in the 1990s recession; presumably, that is a consequence of the fact that secondary schools have maintained the very high retention to year 13 during the 2000s, meaning that a higher proportion of the cohort had the right to enter degree study.
Levels 4-6
Figure 2 does the same analysis for diploma Level 4 certificates qualifications, another type of “entry-level” qualification in tertiary education providers.
Figure 2: The relation between enrolment in qualifications at Levels 4-6 and the unemployment rate through the GFC and beyond
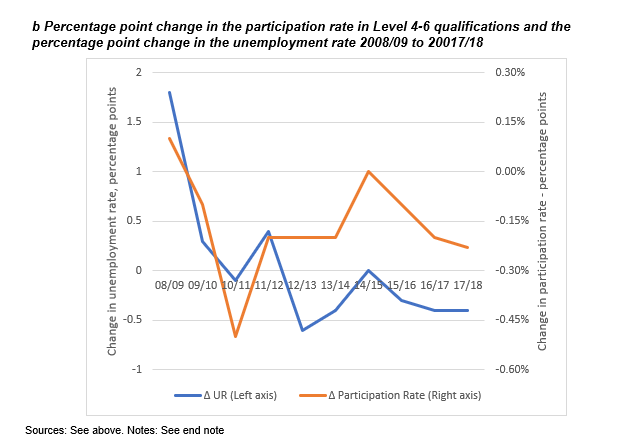
At this level too, there was an apparent association between unemployment and participation. Enrolments in these qualifications have been in slow, but steady decline. The rise in unemployment in 2009 saw a reversal of the trend, but as unemployment stabilised and then fell, enrolments in these qualifications continued to fall. The rising levels of school retention and achievement may also have counted against these qualifications, as more school leavers had the opportunity to move into other forms of training.
Short post-graduate qualifications
Another area of study that followed the unemployment rate in the early 1990s recession was progression from bachelors degrees to short post-graduate qualifications: honours degrees, graduate and postgraduate certificates and diplomas. These are all qualifications of one year’s duration or less, building on bachelors study. These qualifications may be used by bachelors graduates to enhance their attractiveness to potential employers while they “wait for” employment opportunities.
Figure 3: The relation between enrolment in short postgraduate qualifications and the unemployment rate through the GFC and beyond
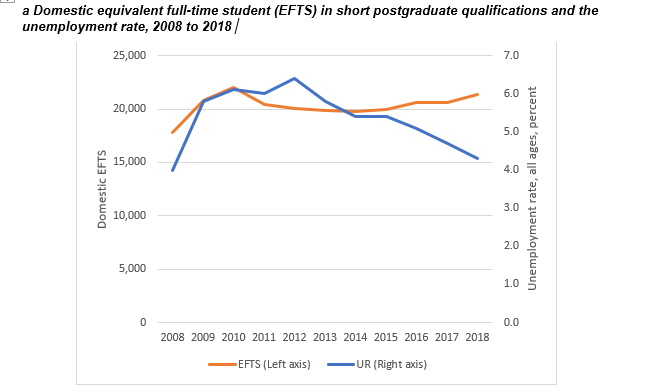
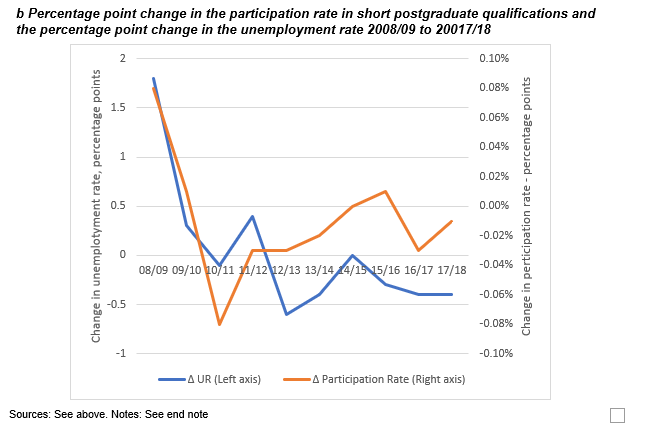
Here too, there appears to be a strong link between enrolments and unemployment especially in the early years of the recession. but participation in these qualifications continued to grow even after employment improved.
What can we learn
The GFC saw a direct and rapid relationship between unemployment and enrolment levels at all three levels. Across the whole system and at all levels, enrolments rose nearly 7% between 2008 and 2009. By 2012, when unemployment peaked, domestic bachelors enrolments were 15% up on 2008 and short postgraduate enrolments were 14% up. With Level 4-6 qualifications, enrolments grew initially in response to unemployment then fell away; by 2012, they were 4% below the 2008 level.
And other factors were influencing participation in tertiary education over those years. The three most significant were:
- The introduction of enrolment caps: From the late 1990s until 2008, funding for tertiary education providers was demand driven, meaning that any new domestic enrolment generated funding. In 2007, the government announced the return of enrolment caps from 2009, with providers required to keep enrolments to between 97% and 103% of their funding caps. While enrolment caps would be set to reflect demand, no one was expecting the large change in unemployment that hit in 2009. Polytechnics, in particular, faced more applications than they could accommodate.
- Changes to foundation tertiary education: In 2009, the government worked on the introduction of the Youth Guarantee programme which, over the succeeding years, replaced many Level 1 and 2 programmes and, ultimately, the Youth Training programme, making it difficult to interpret participation data at lower qualification levels.
- The Canterbury earthquakes: The surge in enrolments across the system that occurred in 2009 was followed by a rise of 2% in 2010. But when the February 2011 Canterbury earthquake hit, there was a drop in EFTS across the country of nearly 3%.
The GFC changes described above need to be seen in that context. The major take-home is that the enrolment response to the GFC was significant and immediate. Unlike the previous recessions, the increases were felt more strongly at the bachelors level than in the sub-degree level.
Because of the difference between different recessions, we can’t assume exactly the same pattern of response this time round, but, suffice it to say, Chris Hipkins was on safe ground when he spoke to the media about the likelihood of increases in enrolments.
What needs to happen, however, is that the Ministry of Education’s forecasting model – which will provide the basis for the 2021 enrolment caps, and which, in 2019, had been predicting that 2021 enrolments would be a mere 0.6% up on 2020 – will need careful reconstruction.
What about vocational education and training
That’s my topic for next time.
References
Crampton E (2020) Open for minds: Export education and recovery, New Zealand Initiative
Ministry of Education (2019) New Zealand tertiary education demand forecast 2019 Ministry of Education
Ministry of Education (2018) New Zealand tertiary education demand forecast 2018 Ministry of Education
Smart W (2009) Ebbs and flows: Participation in post-compulsory education over the economic cycle Ministry of Education
Smyth R (2012) Twenty years in the life of a small tertiary education system OECD
Usher A and R Dunn (2009) On the brink: How the recession of 2009 will affect post-secondary education, Educational Policy Institute
Notes:
This analysis used annual unemployment rates for the year to December, drawn from Statistics NZ’s Infoshare.
Data on equivalent full-time student (EFTS) enrolments and tertiary education participation rates were obtained from the Ministry of Education’s Education Counts.
Participation rates for Levels 4-6 qualifications were obtained by adding rates for Level 4 Certificates to the rates for Level 5-6 Diplomas. That leads to a marginal overstatement of the participation rate as some individuals can be enrolled in both groups in the same year. However, the distortion is negligible because we focus on percentage point differences, rather than using the participation rate alone. The same technique was used for the analysis of “short post-graduate” qualifications.
We also tested other possible proxies for the recession – especially, the youth unemployment rate, used by Smart (2009) and by the Ministry of Education (2018 and 2019). Those analyses didn’t produce materially different results. Other types of education – such as masters enrolments – appeared, on testing, relatively unaffected by the GFC. Policy changes in Level 1 and 2 post-secondary education mean that it was not possible to create a time-series long enough to test for recession effects.
Calculations of the number of domestic students needed to recover all international student revenue were based on data from the TEC.
