One of the big questions for the University Advisory Group (UAG) has to be how to fund research in universities. That’s urgent because the upcoming quality evaluation of research under the PBRF has been scrapped. Scrapped because, while the PBRF had led to a lift in research performance, the government argued that a research performance culture is now embedded in our universities and that the rate of improvement in performance has slowed. If so, government reasoned, there are now only marginal benefits from the unpopular and high-compliance PBRF system.
So one of the big challenges facing the government is to design a new approach to research funding. And one of the tasks in the UAG remit has been to come up with advice on how to reshape the research funding system – advice that the government will look at as it decides on the way forward.
While we wait for the UAG’s report and the government’s call on their advice, it’s worth checking out the data, looking to see whether university research performance has actually continued to improve and if so, if the rate of improvement has in fact slowed.
How the PBRF lifted research performance
The 2020 review of the PBRF found that the PBRF “has increased the overall quality and quantity of research in New Zealand, research is more central to tertiary education, …. It has contributed to a doubling of the number of staff making a significant contribution to research activity and rewarded previously unrecognised research strengths …”.
Analysis shows that the proportion of academic staff in TEIs participating in the PBRF who received a grade of C or better in the PBRF increased significantly (from 49% to 56%) over the first three PBRF quality evaluation rounds. And individual researchers increased their grades over time, justifying the finding of the 2020 PBRF review panel, quoted above.
All that suggests that, compared with before the PBRF, our universities have a much deeper research culture, and a greater focus on research performance.
Triangulating
But those findings, internal to the PBRF system, need to be triangulated by independent, objective measures of research performance – measures that don’t rely on participation in the PBRF assessment system, that are unaffected by trends such as improvements in the way that individuals’ research portfolios are prepared and presented for assessment[1].
To deal with that issue, Ministry of Education researcher Warren Smart used bibliometric measures as a point of reference to look at the impact of the PBRF on the research performance of New Zealand tertiary education institutions. The measures he used were:
- the New Zealand tertiary education system’s share of the world’s scientific/research publications indexed in the Web of Science[2]
- the system’s share of world citations[3].
Figure 1 below, drawn from Warren Smart’s 2013 analysis, showed that the share of world publications of New Zealand TEIs was stable during the 1980s and began a slow but steady increase from the mid-1990s. The increase in the share of publications from the mid-1990s coincided with the government’s changes (and planned changes) to the funding system in ways that would enhance research performance[4]. There was a further lift from the beginning of the 2000s, when the PBRF was mooted and then designed and implemented.
What is more significant is the lift in the world share of citations from the beginning of the 2000s, sharper than the increase in publications. This coincided with the focus on research quality domestically that began with the government’s 1998 white paper on tertiary education. And also with an increasing international focus on university reputation, and with the arrival of the first international university ranking systems ….
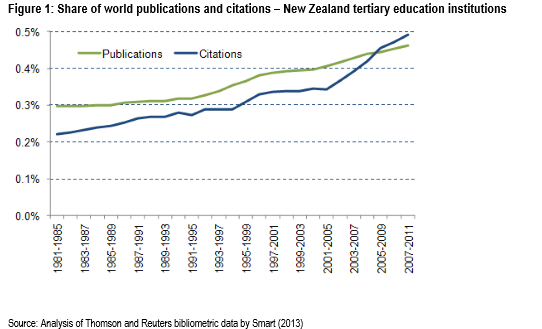
The trends shown in Figure 1 can be interpreted as a prioritisation of quality over quantity in research from the period of the PBRF[5]; by the end of the period, New Zealand TEIs were more highly cited than the world average – a reversal of the situation that applied in 2000.
This is not to imply that the PBRF was the sole driver of the lift. Rather, the PBRF was a response to an emerging international focus on research, one that helped reinforce the emerging change in university culture.
Of course, citations are an imperfect measure of research quality. Quality is multi-dimensional, covering such aspects as social value and originality, as well as scientific impact. Citations reflect some, not all, of those dimensions of quality. Despite those (and other) reservations, the trends shown in Figure 1 suggest that the introduction of the PBRF coincided with a shift to greater volume of research and, most especially, with improved research quality.
Looking forward
So, more than two decades after the first PBRF quality evaluation and, as the government thinks about a new research funding approach, it’s important to get a sense of how well that lift has been embedded in university culture.
Below, we explore the questions: How have New Zealand’s universities bibliometric measures shifted since 2010? Has the momentum evident in Warren Smart’s 2013 bibliometric analysis been maintained?
To do that, we look at a number of bibliometric measures of research quality to check how New Zealand’s universities have performed in their research over the recent past. We also compare the performance of the system with university systems in other small, advanced economies (Denmark, Finland, Ireland, Norway and Singapore)[6] and with Australia. We ask:
- How does New Zealand compare to its peers? To the rest of the world?
- How has that comparison shifted over time?
The data
Each year the Centre for Science and Technology Studies (CWTS) at Leiden University produces a set of research performance indicators drawn from Web of Science bibliometric data. The Leiden datasets have three important advantages over the raw data used by Warren in his 2013 analysis:
- It allows us to use fractional counts: Fractional counting means that if a paper has (say) six authors, three from university A, two from B and one from C, then the paper and each citation is counted as 0.5 to A, 0.333 to B and 0.167 to C. When we want to compare the performance of universities (or countries), it is much more accurate and much fairer to use fractional counting.
- It allows for normalisation by field of research: There are differences between the publication conventions of different fields of research, so highly cited papers in Field X might typically attract many, many more cites than a highly cited paper in Field Y. CWTS provides citation indicators that are normalised for field of research. We can report on the number of normalised citations, removing the distortions that result from differences in citation conventions between fields.
But CWTS applies scale thresholds. Of the New Zealand universities, Lincoln does not meet the criterion for inclusion. The same applies for some of the institutions in our comparator countries. For instance, only seven of the nine Irish universities and only three of the seven universities in Singapore are included.
In this analysis, we present indicators at national level, not broken down by field or university.
The analysis
Updating the comparison with the rest of the world
The trend illustrated in Figure 1 above was important in establishing the impact of the PBRF on university research. This analysis sets out to update those findings, but using the CWTS data, fractional counting and normalisation of citation counts. It looks at the change between the period 2007/10 and 2019/22 in the share of indexed publications and normalised citations.
Calculating the share of world publications is problematic because the period being looked at has seen phenomenal growth in the research performance of Chinese universities – which have recently become the world’s leading producer of indexed research. Between 2007/10 and 2019/22, the number of indexed university publications grew by 95%, but Chinese universities grew their count by more than 440%. Taking China out of the picture, the world count grew by only 55%. Likewise, with normalised citations, the world grew by 96% while China increased its number by 620%. The growth in the world without China was only 51%. Nearly half the world’s research growth over that period is attributable to the rise of China.
Therefore, Figure 2 shows the New Zealand share of the figure for the world without China.
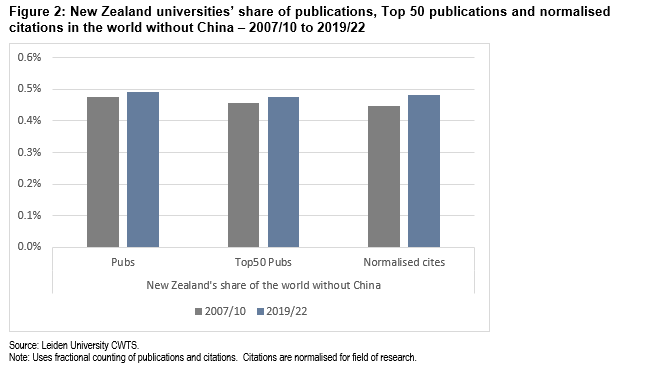
So over that period, New Zealand improved its standing on all three measures, if by a small amount. So, the momentum seen in Figure 1 was sustained.
Comparing our performance with other countries
So, if Figure 1 shows continued (if modest) improvement by NZ universities, how does that stack up against the countries we want to compare ourselves with – our neighbour Australia and the five small advanced, high-income countries.
Comparing New Zealand with other countries, we use two other performance indicators:
- The mean normalised citation score (MNCS) – This compares the number of citations for each publication compared with the mean for all publications in that field of study. If an institution (or country) gets a MNCS score of greater than 1.0, this indicates that the publications have attracted more citations than the mean for all publications, normalised for field of research.
- The percentage of publications in the top 50% (PP Top50) – This calculates the proportion of the publications from the institution or country whose citation count is above the median for that field of study.
Those two measures are scale independent, so they enable us to compare New Zealand with a large country like Australia as well as with other small countries.
Figure 3 looks at the change in the MNCS and in the proportion of publications in the Top 50% over that time, in New Zealand and those other countries (noting that these two measures are scale independent).
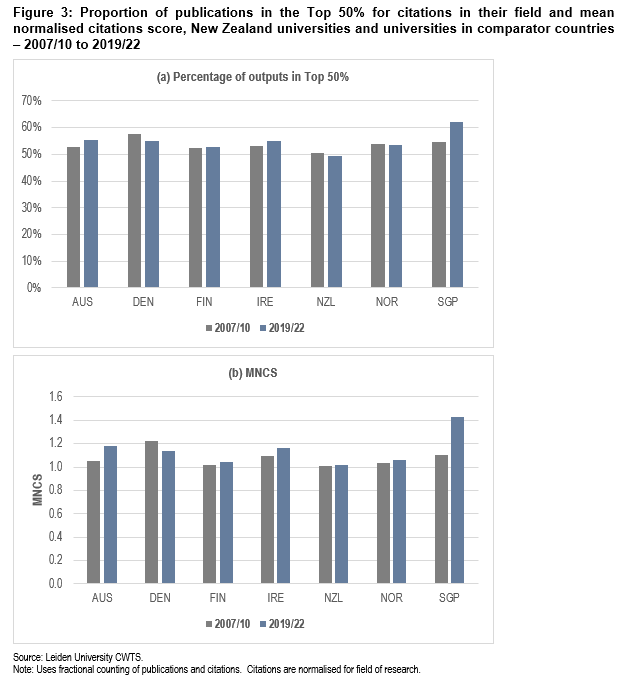
These two graphs give a measure of the extent to which our university system’s research performance meets “international standards” – which is a requirement of our universities under the Education and Training Act 2020[7]. A Top50 score of above 50% is above the expected world level, as is a MNCS of greater than 1.0
Figure 3 shows that, apart from the recent significant lift in performance by Singapore, the other six countries in the analysis are reasonably close. However, what is clear from the graph is that (notwithstanding the improvement over time noted above) New Zealand is the most modest performer on both measures among the countries shown.
And while the number of Top50 publications from NZ universities grew between 2007/10 and 2019/22 and the share of the world Top50 publications grew, the proportion of Top50 publications actually fell, dropping to just under 50% — the expected level for a system performing at world standard. Sure, it’s only one indicator but we need to watch that it is not early warning of a shift towards the prioritisation of quantity over quality.
It’s also interesting that data on these two measures on the seven NZ universities – shown in a companion post to this one – shows that only three institutions had exceeded an MNCS score of 1.0 in the two periods under discussion (UA in both periods, UO in 2007/10 and UW in 2019/22). And that only two (UA in both periods and UO in the earlier period) had a Top50 reading of greater than 50%.
So what does this mean for the research funding system
The data shown here suggests that Tim Fowler, CE of the TEC, was correct when he told the select committee in February 2024 that the PBRF had led to a lift in research performance but that the returns on that high compliance funding approach were now marginal. The evidence is that research performance has continued to improve but at a slower rate. But … on the measures looked at here, it’s not clear if we are quite footing it with our comparator countries. And nor is it clear that all our universities are actually quite meeting “international standards”.
Of course, this analysis has focused on only one dimension and aspect of research – publications captured in bibliometric measures – and there are other dimensions of research quality that are not amenable to objective, quantitative measurement.
But it does raise the question: Are we ready yet to take the foot off the research performance accelerator?
Bibliography
Aksnes D and Sivertsen G (2023). Global trends in international research collaboration, 1980- 2021. Journal of Data and Information Science, 8(2), 26–42.
Crawford R (2016) History of tertiary education reforms in New Zealand Research Note 2016/1, New Zealand Productivity Commission
Inglis M, Gadd E and Stokoe E (2024) What is a high-quality research environment? Evidence from the UK’s research excellence framework Research Evaluation, 2024, 00, 1–16
Roberts P and Peters M (2018) A critique of the Tertiary Education White Paper NZ Annual Review of Education, 8, 5-26
Smart W (2019) Government funding for research-led teaching and research performance: an analysis of PBRF and research top-ups funding allocations Ministry of Education
Smart W (2013) Analysis of the impact of the PBRF – interim findings Ministry of Education
Smart W and Engler R (2013) In pursuit of excellence: Analysing the results of New Zealand’s PBRF quality evaluations Ministry of Education
Smith L, Larner W, Phipps D, Town I, Underhill-Sem Y, Williams M and Mischewski B (2020) Toward the Tertiary Research Excellence Evaluation (TREE): the report of the PBRF Review Panel Ministry of Education
Smyth R (2012) 20 years in the life of a small tertiary education systemOECD
Teplitskiy M, Duede E, Menietti M and Lakhan K (2022) How status of research papers affects the way they are read and citedResearch Policy 51 (2022) 104484
End notes
[1] Inglis et al (2024), in a study of the language and the vocabulary of descriptions of the research environment in English universities submitted for assessment in the Research Excellence Framework (REF – a research assessment system used for the allocation of research funding in that country) found that factors relating to choice of topic and choice of words explain 69% of the score awarded by the panels. That and similar findings raise questions about the reliability and consistency of peer assessment of narrative submissions.
[2] The Web of Science is a commercial bibliographic database own by Clarivate Plc, formerly by Thomson Reuters. It used to inform bibliometric analysis.
[3] Note that Warren Smart (2013) used total counts of publications, where a publication with TEI authors from several TEIs was included as one publication in each TEI’s count. He looked at the data in overlapping five-year periods. He was unable to apply a control for variations in publication conventions in different fields of research. He discusses these and other limitations of the Web of Science bibliographic data in his paper.
[4] The government separated a research component in the enrolments-driven tuition funding, and had planned to allocate a portion of research funding via a contestable application process See Smyth (2012), Crawford (2016) and Roberts and Peters (1999)
[5] See, for instance, Asknes et al (2019) and Tipleskiy et al (2022).
[6] The countries selected for the comparison were high-income countries of population 5-6 million.
[7] See Education and Training Act 2020 Section 268 (2)(d)(i)(C)
