Note: This article was published originally in the NZME journal Education Central on 26 March 2018.
The latest edition of the OECD’s indicators collection, Education at a Glance, suggests that New Zealand’s higher education institutions are hard done by. Per student, they spent only 83% of what Australian institutions had to spend and only 93% of the OECD average. Are our institutions really so hard up? Do our students get a raw deal, compared with those in Australia?
Comparing across countries is not easy …
It’s notoriously hard to compare resourcing levels across national boundaries. The data systems never line up quite precisely – even between such similar countries as New Zealand and Australia. So, it’s hard to know if we are comparing our apples to Australian apples or Australian oranges. The two countries have different cost structures. And the resourcing systems are so different. And resourcing levels depend on the mix of fields of study in an institution. In any case, the Australians have a highly stratified system, in which the Group of Eight (G8) elite, research-intensive universities have a different revenue profile from other Australian universities. New Zealand, by contrast, has a homogeneous system. These are all factors that make a fair comparison difficult.
The best measure of comparative resourcing is total revenue per EFTS. Total revenue – from government, fees from students, research contracts – means we don’t have to adjust for differences and idiosyncrasies in the structure of the funding systems. We have to adjust for the scale of institutions – best by working out the revenue per equivalent full-time student (EFTS). And, given the stratification of the Australian system, it’s useful to separate their universities into groups: a)the G8 elite universities; b) the non-G8 universities that predated the reforms in Australia of the late 1980s; and c) those created during and following the late 1980s reforms – mostly former colleges of advanced education and institutes of technology that were encouraged to merge and upgrade to university status.
Table 1 compares revenue per EFTS for the latest year for which we have comparable data on the two countries – 2016.

Source: New Zealand data: university annual reports. Australian data: Department of Education and Training. Currency conversion as at 30 June 2016: Reserve Bank of NZ, https://www.rbnz.govt.nz/statistics/b1 downloaded 14 March 2018. Note: The universities’ revenue data relates only to the parent university business, excluding revenue from subsidiaries. This is because DET’s published financial statistics focus on the parents’ accounts. For the NZ universities, actual parent revenue is sourced from the eight universities’ annual reports for 2016. This means that the NZ university revenue is lower than that reported in the TEC’s consolidated monitoring reports. The Australian universities in the study are those funded by the DET, but exclude the Batchelor Institute of Indigenous Tertiary Education.
Table 1 suggests that New Zealand universities earn roughly the same revenue as non-G8 universities and a lot less than the G8s. And that reflects how these groups of institutions appear in the university rankings – in most of the common rankings, the Universities of Auckland and Otago come in around 9 or 10 in Australasia, below the G8 universities and alongside the best of the non-G8s.
Looking at purchasing power
But that argument ignores the fact that price levels in each country don’t match the currency exchange rate – $100 Australian won’t have exactly the same purchasing power in Sydney as its equivalent in New Zealand dollars – $NZ104.82 – in Auckland. The OECD comparison uses a standard method for adjusting for differences in the purchasing power of each country’s currency – a purchasing price parity (PPP) index calculated by the World Bank.
Applying the World Bank PPP index (rather than the exchange rate) would give the following:
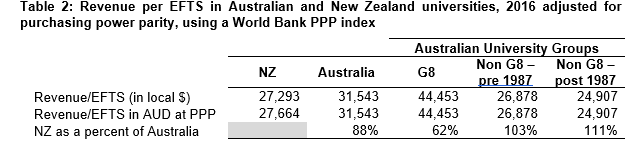
Source: New Zealand data: university annual reports. Australian data: Department of Education and Training. PPP index for 2016 from https://data.worldbank.org/indicator/PA.NUS.PPP. Downloaded 14 March 2018. Notes: Refer to the notes for Table 1
That paints a similar picture to Table 1 but shows the resourcing of New Zealand universities in a slightly more favourable light. New Zealand universities are shown as resourced at slightly above the older non-G8 universities but still well below the G8.
The trouble is that the World Bank’s PPP index looks at differences in price levels across the whole economy, creating an average that works well when we want to compare the purchasing power of individual consumers. But, while individuals typically need to buy a wide range of good and services, universities need a quite different, narrow range of goods and services. So, in comparing university systems between two similar countries, we can do better than the World Bank index.
In the case of higher education, we know that the largest single category of expenditure is staffing. Australian universities spend 54% of all their revenue on staffing and related costs. In New Zealand, the figure is 56%. The remainder of a university’s spending goes to IT, research costs, infrastructure and other operating costs. We have some information on university personnel costs. We all know that Australia has higher wage levels than New Zealand in all industries and occupations – and universities are no exception. That means that each dollar that a New Zealand university spends on staffing goes much, much further than the corresponding amount spent in Australia.
In 2015 (the latest year for which I can source directly comparable data), it cost an Australian university around 1.46 times as much to employ the average staff member as a New Zealand university, meaning the staff purchasing power of Australian universities is little more than two-thirds of the equivalent in New Zealand.
To do a more accurate university PPP comparison, we can make a composite, “true” PPP index. We calculate the staffing expense component by applying the staffing cost differential to their staffing expense and we then convert the residue, the non-staffing costs, using the World Bank approach. I use the World Bank index for the non-staff component in the absence of firm data on the composition of that spending and on price levels for those goods and services in the two countries.
Table 3 shows the same data as Table 2 but applying that composite PPP index, using the differential in personnel costs of 1.46.

Source: New Zealand data: university annual reports for 2016. Australian data: Department of Education and Training (DET). The PPP calculation uses data from the World Bank, the NZ Ministry of Education, the TEC and DET. Notes: the PPP conversion applies actual personnel cost differentials to personnel costs and World Bank PPP factors to the remainder of the revenue. The staffing cost differential is calculated from published DET and TEC data for 2015.
A radically different picture! Applying the true, composite PPP index means that the New Zealand universities’ $3.6 billion revenue in nominal dollars has the same purchasing power as nearly $4.6 billion in Australian dollars. Table 3 paints a different (and more accurate) story than Tables 1 and 2; it suggests that New Zealand universities have higher unit revenue than the Australians overall, but still less than 80% of the G8 universities.
Sure, the personnel costs data may not be exactly comparable between the two countries, and the staffing cost differential may well have changed since 2015. But even if the ratio of the cost of university staff in Australia to that in NZ was only 1.25 (rather than 1.46 used here) the overall resourcing per EFTS of Australian and New Zealand universities would be equal.
Size matters …
Resourcing is obviously an important factor in university performance. But so is scale. A larger organisation can exploit economies of scale and so get greater value from the resourcing it has, especially in the non-staffing expenditure. Australian universities, on average are 50% bigger than NZ universities; even the larger New Zealand universities are around middle-sized in Australian terms. Auckland is 12th largest university, measured by student load, in Australasia.
So it’s interesting to compare revenue per EFTS to the size of the institution.
Figure 1: Equivalent full-time student (EFTS) load and total revenue per EFTS at true PPP for Australasian universities in 2016

Source: NZ university annual reports, NZ Ministry of Education, Australian Department of Education and Training. Note: Revenue is expressed in PPP at true PPP – see the note to Table 3. The PPP conversion factor is calculated separately for each NZ university, based on the share of its revenue that goes on meeting its personnel costs.
Differences in resourcing levels within each of the four groups in Figure 1 are largely driven by the mix of fields of study and by the ability to raise research revenue; among the New Zealand institutions, Auckland, Otago and Lincoln focus on high-cost, high-revenue fields and have high research income, so they have the highest revenue per EFTS in the New Zealand system. The G8 universities all have medical schools and are the most successful in winning research grants. Five of the G8 universities have more than 40,000 EFTS, as well as high per EFTS revenue. Their resourcing and their scale will both play a part in their high performance.
The University of Otago has a revenue profile and an EFTS load similar to the University of Adelaide and the University of Western Australia. The University of Auckland is slightly bigger than those three and its revenue per EFTS is slightly lower. Otago and Auckland figure in most university rankings lists a bit lower than those two G8 universities.
Victoria University of Wellington has an almost identical size/revenue profile in Figure 1 to Flinders University in Adelaide, one of the pre-1987, non-G8 universities, a member of the Innovative Research Universities (IRU) group. These two institutions perform at a similar level in most of the ranking systems; Flinders is ahead of Victoria in two ranking systems while, despite not having a medical school, Victoria beats Flinders in two.
What does it all mean?
This analysis provides another way of looking at our universities and their resourcing. It raises some important issues and questions.
Our labour costs are lower and funding rates need to reflect that …
Our universities operate in a labour market that traditionally pays workers less than in Australia. In 2015, the average wage in Australia was 1.55 times the average wage here (according to countryeconomy.com). That wage disparity exists in most industries – medicine, mining, building, … It is no less true of higher education. That carries a set of obvious risks for New Zealand, but those risks are not new and nor are they particular to education. And in recent years, we haven’t seen an exodus of professional talent heading for Australia, despite the freedom of movement of labour and despite the wage differential.
One consequence is that organisations in New Zealand, especially those that are highly dependent on labour, face lower costs than their peers in Australia. So, we need to take care to allow for those disparities when we make trans-Tasman comparisons.
The comparison above shows that resourcing for our universities is comparable to the resourcing of Australian universities overall, once we allow for the labour cost differential.
But Australia has a stratified system, we have a homogeneous system …
The strength of the New Zealand university system is that it’s homogeneous – there are no elite, leading institutions, but there are pockets of real excellence, and there are no real weak spots. And our universities are well resourced compared with the middle tier of Australian institutions.
On the other hand, Australia has created a tier of elite, highly resourced universities that can also capitalise on large scale. Those institutions earn 25% more per student than NZ universities. It’s little wonder that the G8 institutions are ranked so high.
Australia also has a set of universities (like Federation University and Central Queensland University) that have a regional mandate and that assess their performance on criteria quite different from the G8. And it has a group of “dual sector” universities (like RMIT University) that straddle the higher education/vocational education divide.
The real question …
What do we need of our university system? In a small country, do we want or need elite universities? Homogeneity is a strength of our system, but do we want more diversity in our system? And if so, how do we want to position university subgroups? Good questions that might be worthy of be adding to the coming 30-year view of the future of education in New Zealand.
