AUT and the Times Higher Education rankings
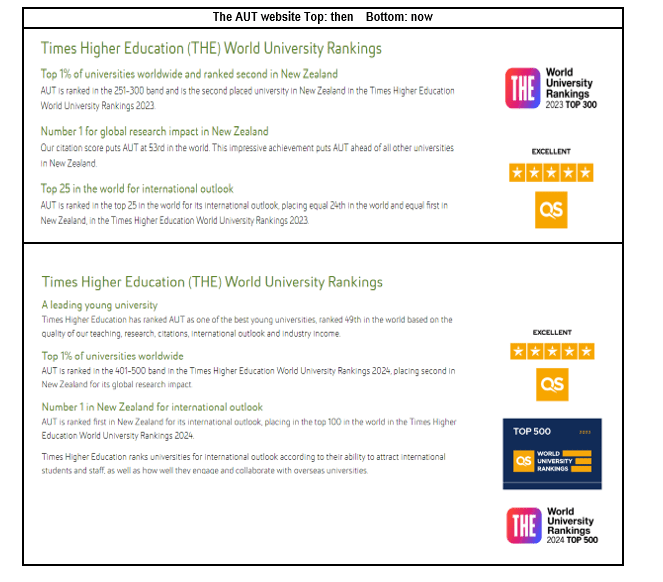
Until Thursday last week, AUT was ranked second among NZ universities in the Times Higher Education (THE) World University Rankings – in the top 300 of the 1,800 universities ranked, a whisker ahead of Otago. And top in NZ for research impact. Until last week.
Now? With the release of the 2024 THE rankings on 27 September, AUT is now in the 401-500 band. Over two years, AUT has fallen at least 150 places in this ranking, likely quite a bit more than that.
What’s gone wrong? Has AUT’s performance suddenly slipped? Lost its edge? The answer: “NO”.
So this note looks at what drove the change. And in the process, it illustrates the weaknesses of these sorts of rankings.
The source of the problem …
The Times Higher Education’s citations measure
AUT’s high score in the THE ranking in the recent past has been a result of its very high score on the Citations measure which counted for 30% of the overall score. In the 2022 listings, AUT was 19th in the world for citations (and in the 201-250 group overall), falling to 53rd in 2023, down, but still good enough to help AUT into the top 300.
The citations measure came from the average number of times that recent research papers produced by a university’s academics were cited by other researchers[1]. That’s a proxy for the influence of the university’s research. If a university’s academics produce more influential research …. intuitively, that’s an obvious indicator of quality. But sometimes one’s intuition can be misleading – it’s not nearly that straightforward.
The Feigin effect
One reason for the strength of AUT in the citations measure in the 2021, 2022 and 2023 releases is that the university hosts the National Institute for Stroke and Applied Neurosciences, an internationally well-connected research centre that won the Prime Minister’s Science Prize in 2022. The Institute is headed by world-leading scientist Professor Valery Feigin, who has a phenomenal research record. If you are impressed by h-factors, Feigin’s currently[2] stands at 131[3]. Over his research career, Feigin’s 691 indexed research papers have attracted nearly 304,000 citations. Six of his papers have attracted more than 10,000 citations each. The most highly cited paper in his record is a 2016 paper that drew more than 65,000 citations. It’s an amazing record.
Feigin is also involved with the Global Burden of Disease (GBD)[4] study that brings together more than 3,000 scientists from 145 countries and that aims to measure “… health loss from hundreds of diseases, injuries, and risk factors, so that health systems can be improved and disparities eliminated”. Like papers produced in other massive multi-national studies[5], GBD papers can have dozens, even hundreds, of authors and tend to be extremely highly cited. A paper can attract tens of thousands of citations.
However, the Feigin effect is slowly diminishing; some of the highest cited articles have dropped out of the counting time-window. In the 2022 release, Feigin’s top five papers had, together, attracted something like 96,000 citations[6]. In the 2023 release, when papers that appeared in 2016 were no longer in the counting window, the corresponding number was around 28,000. In last week’s rankings – the 2024 release – the top five Feigin papers generated 27,000 cites.
This illustrates one of the problems in the design of the citations measure. The most highly cited paper in Feigin’s list – the 2016 paper with the 65,000 cites – was included in the 2022 count but has been excluded since then. That appears to have influenced the score of the university as a whole. AUT moved from 19th in the world for citations in 2022 to 53rd in2023, and its overall position shifted from the 201-250 band to the 251-300 band.
Total vs fractional counting
The THE Citations measure used total counts of citations and calculated the average number of citations per paper[7]. This meant that, if a paper had five authors from five different universities and if it had attracted, say, 200 citations, then each of the five universities would count that as a full paper with 200 citations. Under the alternative counting method, fractional counting, that would be counted for each university as one fifth of a paper with 40 citations.
The difference between fractional and total counts is especially significant for AUT. Analysis of citations data[8] shows that a high proportion of papers produced by AUT academics have co-authors from other universities, much higher than any other NZ university – see the appendix to follow the calculations. As a consequence, a switch to fractional counting would make a very significant difference for AUT. Part of that may be because of the Feigin effect – because he retains affiliations with a number of research centres in Russia and the US. Therefore, many of his collaborators will be from those centres. In addition, his GBD papers will have multiple co-authors, many from other institutions.
Total counting has distorted the citations measure. The distortion was especially significant for universities with academics active in major multi-national projects (like the GBD and CERN’s Large Hadron Collider project). Papers from those projects have a very large number of authors and attract massive citations.
Another, even more striking case, relates to the PRISMA statement, a paper that redefined the approach to systematic meta-analyses, authored by 26 academics from 20 institutions. This paper[9], published in the British Medical Journal, was cited more than 22,000 times over 2021/22. Every researcher who used the method would have cited this paper in the methodology section of the research paper. Under the fractional counting system, each of the 20 universities with a staffer listed as a co-author would be attributed with more than 900 citations (and with 0.04 of a paper). But under total counting all 20 universities would have counted one paper and all 22,000 cites[10].
In his analysis of the performance of Australian universities in the 2023 THE ranking, rankings commentator Richard Holmes attributes the rise of Bond University’s citations score (from 56.4 to 99.7 in one year) largely to the fact that one Bond academic contributed to the PRISMA statement which was included in the count for the first time in the count for the 2023 release of the THE rankings. Australian Catholic University (ACU) had a similar rise as a result, Holmes argues, of the inclusion for the first time of a set of GBD papers[11]. Both Bond and ACU had very significant rises in overall placing in the THE ranking, fuelled by the rise in their Citations scores[12].
That Bond ended up with a higher citations score than a research powerhouses like MIT, Stanford, UC Berkeley and Oxford has to raise serious questions[13].
The regional loading
The problems with the citations measure were compounded by the inclusion of a regional factor in the formula, a loading that favours institutions in countries that have low research impact. This creates a bias against universities in the US, the EU, the UK and China[14].
In the 2023 listing, there were six universities that scored 100 out of a possible 100 in the citations measure, three from Iran, one each from Türkiye, Vietnam and Ethiopia. One of the six achieved an overall rank in the 351-400 group, with the others all ranking lower than 401.
There has been a fundamental change to the citations measure in the 2024 release …
The change …
Experts[15] criticised the design of the old citations measure. It was very volatile, as the Feigin effect shows and as the ACU and Bond cases suggest. The regional loading led to perverse results. THE conceded that the citations measure had “a disproportionate impact on the citation scores of a small number of universities”[16].
One of the consequences of its poor design is that performance on the citations measure did not predict scores on the research measure. Richard Holmes’ (2021) analysis shows that, in the 2020 ranking, the correlation was moderate (coefficient = 0.59) but that when you look solely at the top 200 universities, correlation disappeared almost entirely (coefficient = 0.06). (More detailed analysis on the THE data – especially focused on Australasian universities – is in the appendix to this paper).
That sort of criticism led THE to undertake a major redesign of the measure for its latest release, the 2024 rankings just released[17]. Now the citations measure has been incorporated into a new, broader Research Quality measure that counts for 30% of the final overall score.
- The citations measure counts for only half of the research quality measure (ie, 15% of the total overall score)
- The regional loading in the citations formula has been reduced
- Three new research quality components – each worth 5% of the total, overall score – have been added:
- one counting publications in high impact journals
- one counting citations in high impact papers
- one that looks at the 75th percentile of a university’s citations
On this measure, the 2024 release has AUT at 236th in the world on the research quality measure (against 53rd in citations a year earlier). It is this change that largely explains AUT’s fall from the top 300 to the 401-500 band. THE doesn’t give universities’ exact rankings – instead, grouping them in bands; however, if we were to calculate the exact scores out of 100 for all the Australasian universities[18], the results would suggest that AUT had fallen from second among NZ universities to sixth, from 23rd in Australasia to 35th.
How much difference does this change make?
The new research quality measure is an improvement on the citations measure. It will give a more realistic reading of the impact and influence of research by looking at high impact journals and high impact papers. Looking at the 75th percentile of citations per paper, not just the mean, will moderate cases where a small number of papers (ie, fewer than a quarter of the papers in the counting window) have very high numbers of citations.
Looking at the Australasian universities, the correlation between the Research Environment and Research Quality measures is 0.54 (moderately strong), whereas, in the 2023 data, the correlation between the research and citations measures was lower, 0.41. See the appendix for the detailed analysis.
In addition, the change in methodology has brought the THE ranking closer to the other well-known rankings, the QS and the Shanghai ranking – perhaps giving greater confidence in its reliability. (See the appendix for the data).
But it is not immune from volatility of the kind described above, although the effect will have been dampened.
Of course, like all rankings, it will likely miss socially valuable applied research, of the kind undertaken by research centres and institutes (such as AUT’s Centre for Social Data Analytics and the NZ Work Research Institute[19]) some of whose projects don’t result in journal publications.
What does the fall in AUT’s ranking say about the performance of AUT
The short answer is “nothing much”.
For one thing, rankings use crude proxies for performance; these measures overlook much of an institution’s most valuable work. For instance, AUT has a focus on fostering learner success, it has worked hard at paring back inequity in access to university, it has produced thousands of graduates who have been successful in the labour market, and the research produced by its staff has created genuine value for NZ’s society and economy. The rankings take account only of what is measurable.
The most recent academic audit of AUT[20] – in 2015 – found that:
- AUT is collegial, inclusive, focused on providing opportunity and centred on teaching, learning and student engagement
- its work is evidence-based and data-driven
- the university makes good use of data to inform planning and decision-making
- AUT promotes opportunity, inclusiveness and equity and provides good support services for Māori, Pasifika, disabled and international students.
And, as noted above, AUT academics are producing research that has high social (if not necessarily bibliometric) value.
Those are signs of an institution performing its role successfully in ways that sail beneath the rankings radar.
Secondly, THE uses reputation surveys as part of its data collection. While respondents to the surveys will be experts who are well-informed, they are much more likely to recognise and affirm the reputations of large, established, high reputation institutions in large economies like the US, China and the UK. In other words, reputation surveys will have a bias in favour of universities that already have high reputations. A self-perpetuating system.
Third, much of the international research community communicates in English. Most high impact research is published in high impact journals – which tend to be in English. That will tend to favour institutions in the Anglosphere to an extent.
Fourth, combining imprecise measures in the way that THE does (and as other rankings do) to calculate a numeric score lends a spurious accuracy to the scores – likely why most rankings companies present most universities’ results in bands.
More fundamentally, the frequent changes in the composition and definition of the THE ranking measures and the large shifts that result from those changes serve only to underline that there is no “correct” way to assess performance across the breadth of a university’s work.
Universities are big organisations and big organisations change only very slowly. AUT today is similar to AUT three years ago, performing no worse, whatever the good folk who do the rankings think.
The biggest difference is that AUT has again been obliged to update its website; the international marketing team may have to rework its spiel. One or two prospective international students may drop AUT from their shortlist of possible destinations …. But prospective domestic students will likely be unaware and uninterested, having formed their preferences in the iterative and roundabout ways domestic students do, following their interests, listening to peers and friends, taking on board information from parents, schools role models …
So, what does the drop in ranking mean? It’s much ado about not very much.
References
Academic Quality Agency (2016) Auckland University of Technology Academic Audit Report Cycle 5 Academic Quality Agency
Elbawab, R (2022) University rankings and goals: a cluster analysis. Economies 10: 209.
Gadd E, Holmes R and Shearer J (2021) Developing a method for evaluating global university rankings Scholarly Assessment Reports
Hazelkorn E (2014) Rankings and the global reputation race New Directions for Higher Education · December 2014 DOI: 10.1002/he.20110
Holmes R (2021) THE World University Rankings: indicator correlations University Rankings Watch
Holmes R (2022a) Australia and the HE World Rankings University Rankings Watch
Holmes R (2022b) Where does reputation come from? University Rankings Watch
Marginson S (2014) University rankings and social science European Journal of Education, 49: 1, pp 45-59
Marope P, Wells P and Hazelkorn E (eds) (2013) Rankings and accountability in higher education: uses and misuses UNESCO
Smyth R (2019) How do we find out about university quality Education Central 13 8 19
Usher A (2016) Data and rankings: a healthy debate Inside Higher Education 18 5 16
Usher A (2020) 2020 Rankings round-up Higher Education Strategy Associates
Websites consulted:
British Medical Journal: PRISMA 2020 Statement: https://www.bmj.com/content/372/bmj.n71
CERN: https://www.home.cern/
Large Hadron Collider: https://www.home.cern/science/accelerators/large-hadron-collider
Clarivate Highly Cited Researchers: https://clarivate.com/highly-cited-researchers/
Global Burden of Disease: https://www.healthdata.org/gbd
Google Scholar: https://scholar.google.com/
Higher Education Strategy Associates: https://higheredstrategy.com/
Leiden University CWTS: https://www.leidenranking.com/
Ministry of Education Rankings Factsheets https://www.educationcounts.govt.nz/publications/tertiary_education/nz-university-rankings
Times Higher Education World University Rankings https://www.timeshighereducation.com/world-university-rankings
THE WUR Methodology 2024: https://www.timeshighereducation.com/world-university-rankings/world-university-rankings-2024-methodology
THE WUR Methodology 2023: https://www.timeshighereducation.com/world-university-rankings/world-university-rankings-2023-methodology
University Rankings Watch: https://rankingwatch.blogspot.com/
End notes
[1] Normalised for field of research – ie, correcting for differences between fields in research and citation conventions and practices.
[2] As at 25 September 2023. The data in this section are sourced from Valery’s Feigin’s Google Scholar record.
[3] Which means that 131 of his papers have attracted 131 or more citations. Feigin is likely the most highly cited scholar currently working in a NZ university.
To get an idea of the scale of Feigin’s achievement, Michael Hall of the University of Canterbury and (the late, celebrated) Richie Poulton of the University of Otago both have higher h-factors (152 and 136 respectively) than Feigin but even adding their citations together comes to much less than Feigin’s 300,000 citations. The highly productive and noted University of Auckland scientist, Dame Margaret Brimble has 15,600 citations and an h-factor of 53.
[4] The GBD study is based at the University of Washington and is funded by the Bill and Melinda Gates Foundation.
[5] For instance, the projects run by the pan-European centre CERN, which built the Large Hadron Collider
[6] Each year’s release counts citations in the current and the preceding five years. The 2022 release, which appeared in 2021 counted citations in all papers in the Elsevier Scopus database which appeared between 2016 and 2021. That included Feigin’s most highly cited paper (which appeared in 2016); but that paper dropped out of counts in subsequent THE rankings releases.
[7] Normalised for field of research – ie, correcting for differences between fields in research and citation conventions and practices.
[8] From the Leiden University’s CWTS data, that gives total and fractional counts, normalised by field of study, for all large universities.
[10] Under total counts, each author would have been attributed with all 22,300 citations. However, using fractional counting, the University of Ottawa is allocated 4,472 citations, the Monash University 3,354, the University of Bristol 2,236 and 15 other universities 1,118.
[11] Refer to Holmes (2022a) Australia and the THE World Rankings.
[12] Both Bond and ACU were lifted from the 501-600 band to the 251-300 band, a rise of between 201 and 349 places.
[13] Interestingly, it appears that the Bond academic who contributed to PRISMA has left Bond; in the 2024 THE ranking, with the result that Bond fell from 19th among the Australian universities in 2023 to 30th in 2024.
[14] See Holmes (2022) for an explanation of how this element works.
[15] Refer for instance to: Gadd et al (2021), Holmes (2014), Holmes (2021), Holmes (2022a), Holmes et al (2022b), Marginson (2014), Usher (2016), Usher (2020)
[16] Refer to THE’s methodology notes on the 2023 THE WUR.
[17] This isn’t the only change for 2024. The Industry measure has been redesigned to include a patents component and increased from 2.5% of the total to 4%, with drops of 1 percentage point on the Research Environment measure and 0.5 percentage points in the teaching measure.
[18] Note that, combining imprecise measures to give an exact score, creates a risk of generating spurious accuracy – falsely seeming to be precise.
[19] Both of those centres undertake some of their research under contract to clients such as government agencies – those contracts are recognised in the THE rankings through the Research Income component which is part of the Research Environment measure.
[20] Academic Quality Agency (2016) Auckland University of Technology Academic Audit Report Cycle 5
