Recent analysis by the Ministry of Education researcher David Scott[1] found that high-performing school leavers are increasingly choosing to go overseas after finishing school – around 5% to 6% of those with high grades in NCEA. And the proportion is higher among those who attend private schools (7%-10%) and among those who took international high school qualifications[2] in preference to NCEA (8%-12%). Now it’s not clear what proportion of those who went overseas were taking a gap year, how many were part of families moving abroad. But some – we can’t tell how many – were choosing university study overseas over study in New Zealand.
Meanwhile, the university admissions consultancy Crimson Education reports that more than 500 of its clients won places in US universities in 2023/24. The NZ Herald columnist Matthew Hooton chimed in: “… most of our very top secondary students now immediately leave our country and go to university in one of those genuinely first-world countries, never to return …” he claimed. Given the statistics, that might be a creative use of the term “most”. But the point remains …
As David Scott notes: “While this trend could reflect concerns about the quality of New Zealand universities, it could just indicate the growing normalisation of overseas study, particularly among high socio-economic households”.
People going overseas for postgraduate study is positive and, in some fields, logical and sensible; but for undergraduate study? That’s a wholly different question. So despite the uncertainty, David’s analysis raises important questions about the nature and design of our university system.
The University Advisory Group has wrapped up its report, put down its tools and gone home. While weeks turn into months, while the public’s attention turns to the VET system and the school system, we wait for the government to think about the UAG report and come up with a refreshed direction for the universities. Will the UAG address this difficult issue?
This article looks into one of the distinctive features of our university network – its lack of stratification – comparing New Zealand (inevitably) with Australia, but also with other high-income countries with a population of between 5 and 6 million – Denmark, Finland, Ireland, Norway and Singapore. I explore some of the trade-offs we make in maintaining a non-stratified system and ask whether it might be in the mind of government ministers to shift this feature of the system.
Measuring stratification
We know that nearly all university ranking systems are flawed and that they have biases that make them unreliable as a means of comparing individual institutions[3]. But looking across a range of ranking systems can provide a rough index to the relative performance of higher education systems. Analysing data from the four most common ranking systems – Quacquarelli Symonds (QS), the Shanghai ARWU system, Times Higher Education (THE) system and the Leiden University research rankings and looking at the spread of institutional scores in each country gives a view of the extent of the stratification in a country’s higher education system.
A base level of performance …
In most ranking systems, an institution must meet a baseline level of performance to earn inclusion. So the extent to which each country’s university systems are covered in the rankings gives a (crude) first-level view of how performance is distributed across the system. Figure 1, below, shows that, overall, New Zealand has the highest proportion of its system meeting the criteria for inclusion in the ranking systems, with Australia and Ireland also showing high levels of inclusion. Singapore, where there are relatively few universities and where many of the institutions are highly specialised[4] has the lowest level of inclusion in rankings.
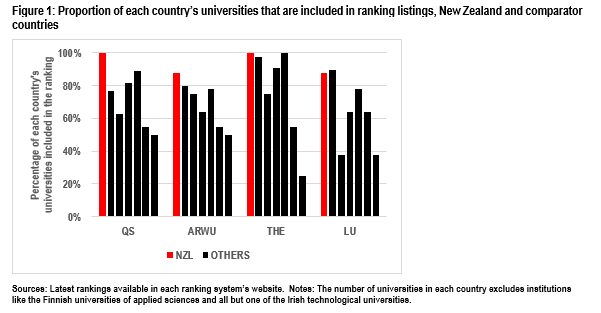
In fact, the only NZ university that isn’t included in all of the ranking systems is Lincoln which doesn’t meet the size threshold for inclusion in the Leiden ranking and which, when it last appeared in the ARWU list (2023), was the highest ranked NZ university on its size-adjusted per capita performance indicator.
In short, all eight NZ universities meet a base performance threshold on that analysis.
… but there are no outstanding performers …
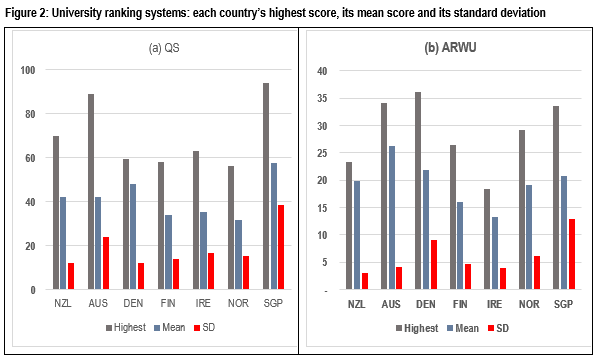
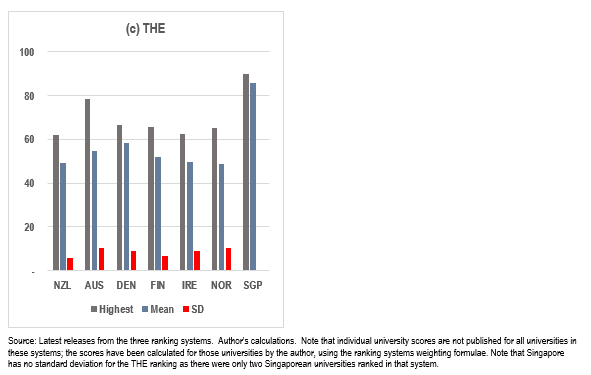
The most recent release of the THE ranking system shows that the average institutional score for New Zealand is the lowest among the countries considered and that the score of the leading university (UA) is below that of the leading university in each of the comparator countries. In the ARWU, NZ is fourth in mean score and the leading institution (again, UA) is sixth out of the leading universities in the seven countries. In QS, NZ appears stronger; third equal in average score and the third among the leading universities (UA, yet again).
… and very low spread of scores
New Zealand’s point of difference is in measures of the spread of scores – in all three ranking systems, the scores of the universities in New Zealand have the lowest standard deviation and the lowest inter-quartile range of the countries analysed.
By contrast, Singapore and Australia both have universities that are among the world’s elite. Their measures of spread – especially Singapore’s – are therefore relatively high.
Figure 2 below contains graphs that illustrate these findings.
Looking at data on research performance …
The Leiden University ranking differs from the others. Unlike the other three, the Leiden has no survey data, no data supplied by the universities and it makes no pretence of constructing a single score through a formula that weights and combines discrete measures. No, Leiden data is focused solely on research data, objective bibliometric data that is quality assured and verifiable.
This means that the Leiden ranking has a wide range of measures. One important performance indicator is the Mean Normalised Citation Score (MNCS) – often called a Field-Weighted Citation Impact (FWCI) measure. This gives the mean of the expected number of citations of the research publications, adjusted for differences in the citation rates by field of research. It is a scale-independent measure. A score greater than 1.0 means that a paper has attracted more citations than the world mean in that field of research.
Figure 3, below, sets out the results for the seven countries for research published between 2019 and 2022.
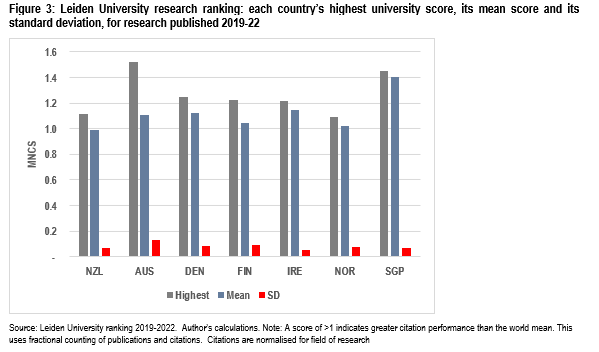
Singapore has the highest scoring university system on this measure with the NZ having the only country mean (fractionally) lower than the world standard of 1.0. New Zealand, Ireland and Singapore have low standard deviations.
Looking at individual universities’ research performance
Another way of assessing the level of stratification in New Zealand’s system is to look at bibliometric performance measures for each of the seven universities listed in the Leiden data.
Figure 4 below shows the MNCS for the seven ranked New Zealand universities in 2007/10 and 2019/22.
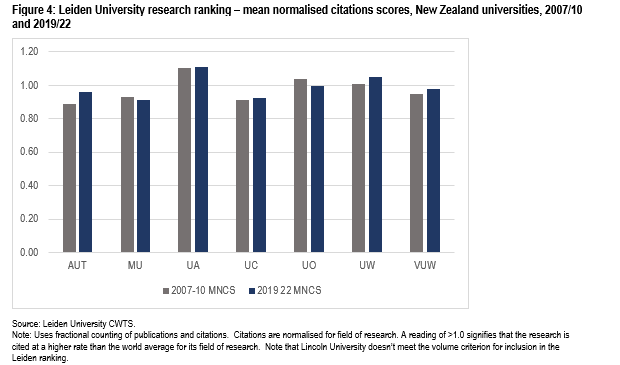
Auckland rates higher than the others in both periods (although the difference between Auckland and Waikato in the 2019-22 period is marginal). The other five are all very close, with the differences not statistically significant.
Another useful research performance measure is the proportion of publications in the top 50% of citations in their field. If a university has a score on this measure of >50%, that is another indicator that the university’s research, overall, is of world standard on this measure.
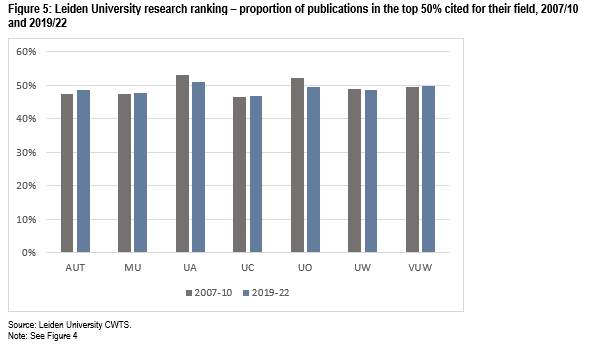
The readings of the seven universities in both periods are clustered between 47% and 53%, showing that all seven are either just above or just below the benchmark of 50%. Of the NZ universities, Auckland is the highest in each period, but as in the other rankings, the differences in measured performance are slight.
Resourcing for homogeneity
The homogeneity of performance reflects homogeneity of resourcing. Table 1 below gives data on the distribution of income (from all sources, government, tuition fees, research contracts, trading) per equivalent full-time student for New Zealand’s universities for the year 2023 and compares that with the corresponding figures for the Australian system[5]
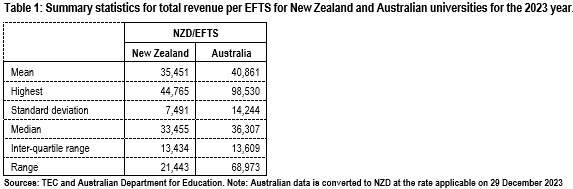
The New Zealand universities resourcing per EFTS sees a group of three (LU, UA and UO) earning around $44k/EFTS, likely reflecting the high-cost fields they deliver and also their international student load, two universities (UC and AUT) earning less than $30k/EFTS and the others earning between $31k and $34k.
The difference between Australia and New Zealand is clear. The spread of resourcing in Australia is much greater, with a much higher standard deviation and an extremely wide range.
What is interesting about Table 1 is that the inter-quartile range in both countries is so very close. What that suggests is that the large spread in resourcing in Australia results from the universities in the upper quartile; the universities in the Group of 8 research intensive universities (who dominate research funding and have large proportions of high-paying international students) are all above the upper quartile. Remove the G8 universities and we get Table 2:
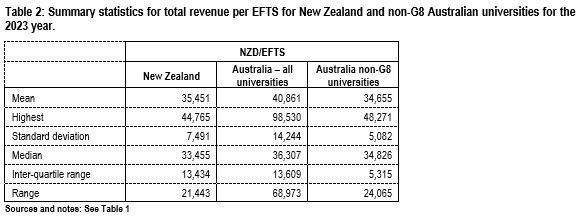
The distribution of resourcing in New Zealand is remarkably close to that of the non-G8 universities. In effect, the extreme spread in Australia is entirely due to the very high resourcing applied to the G8 universities who – not coincidentally – are those that score highly in the rankings, leading to the wide spread in performance among Australian universities noted above.
A system for a small population
How come we have a peculiarly homogeneous system?
Our small population – less than 5.4 million – has spread through a long thin land, 1,600 km from Otou North Cape to South Cape at the southern tip of Rakiura Stewart Island. We have one large city. Around 19 people per square kilometre. And, until recent decades, a not especially well-developed transport system.
Universities – with a research mission as well as a teaching role – are the most expensive parts of any education system, so economies of scale matter. With relatively low population density, there is a trade-off between spreading our university capability through the country and creating economies of scale. The way our system has evolved sees university teaching offered face to face in six moderately large centres, with significant university campuses spread along an axis of 1,100 km north to south, complemented by distance delivery and a smattering of satellite campuses[6]. The network we have evolved is a response to the pattern of population growth in this country over the last 150+ years, as well as to the relative isolation of our population centres. While each of the eight universities has some particular disciplinary strengths and specialisations and while some high-cost fields are offered in only some universities[7], it is possible to take a bachelors-level qualification in most fields in universities in centres that house two-thirds of the population.
Six of the eight universities can trace their origin to the University of New Zealand, split up in 1961. And for the next three decades, policy actively discouraged competition between institutions and required the universities to develop as a system. After a decade of a more open, competitive approach in the 1990s, the government moved to moderate competitive pressures and imposed further barriers to new entrants to the system.
So while New Zealand’s universities may be differentiated in their specialisations and in their focus, as a system, it is less stratified than the systems in countries we compare ourselves to. That feature has strengths. It gives confidence that there is a minimum standard that all the universities meet or exceed. It helps the eight universities act as a system, dampening destructive competitive pressures at an institutional level. That’s positive.
The downside of an unstratified system is a lack of diversity in the universities; there is no New Zealand university that could claim to be world leading in research, for instance. Even the highest performing of the eight New Zealand universities is only middling among the leading universities in the six comparator countries. It’s that lack of stratification that fuels Matthew Hooton’s temper and that enhances the business opportunity for Crimson.
In other words, there is a trade-off – between homogeneity on the one hand and elite institutions on the other.
It’s an issue that has only made it onto the political agenda once – in 2017, when National went into the election with a commitment to raise one university to an elite level. It’s an idea that the party has never revived.
Will the UAG raise the issue of the question of stratification? Is the government interested? The analysis in this note suggests that a move in that direction would be costly as well as disruptive. And hence, not likely!
Endnotes
[1] Scott D (2025) Recent trends in school leavers going overseas Ministry of Education
[2] International Baccalaureate and Cambridge International
[3]See, for instance, among dozens of comments, Marginson S (2013) University Rankings and Social Science European Journal of Education 49(1) 45-59. See also Richard Holmes’ blogspot Ranking Watch and this comment.
[4] For instance, the Singapore Management University, the Singapore University of Technology and the Singapore University of Social Sciences.
[5] Note policy differences and data availability mean it isn’t possible to make a fair comparison of NZ against the other countries discussed in this paper
[6] From the Whangarei satellite of the University of Auckland to the Otago satellite in Invercargill is a distance of 1,300 km. The Tauranga campus adds an east west dimension to the network – roughly 80km.
[7] Veterinary science and dentistry are each available in only one university. Medicine and agricultural science are each offered in two universities, in each case, one North Island university, one South Island university. Physiotherapy degrees are available in only two universities (but also in one polytechnic).
