The effects of the pandemic on New Zealand’s universities
Early in 2020, when the pandemic hit, no one knew how hard it would hit the tertiary education sector. Closed borders meant that international students would be unable to enrol, the international students on whose fees many institutions depend for their financial health. In 2019, the universities had collected $560 million in tuition fees from international students – more than one-eighth of their total revenue. What would happen?
Grant Guilford, then vice-chancellor of Victoria University | Te Heranga Waka, told the parliamentary select committee on the pandemic response that the universities were forecasting a collective deficit of nearly $400 million in 2021, whereas in 2019, they had made a surplus of more than $170 million. That represented a turn-around of more than a half billion dollars in only two years. He explained to RNZ that he expected his university to lose $50 million in income and therefore, he was considering a proposal to reduce staff pay by 20%.
The minister, Chris Hipkins, was unmoved. He told the select committee that the universities had healthy balance sheets, and therefore could be expected to “weather” the crisis. On 1News, he said that universities were financially strong but would need to adapt to having fewer international students – noting also that forecast increases in unemployment would likely drive up domestic enrolments.
Two years on, let’s look at what actually happened. Who was right?
What happened to enrolments
International enrolments at universities fell by 9% in 2020 and by a further 15% in 2021. However, as the minister had predicted, domestic enrolments rose, offsetting that drop. There was a 2% increase in domestic enrolments in 2020 and a further 7% rise in 2021 as the economy stagnated – so that total enrolments rose slightly.
Figure 1: Enrolments at universities in equivalent full-time student (EFTS) units, domestic and international, 2016-2021

Source: Ministry of Education, Education Counts
What may have surprised some was how resilient international enrolments were. Yes, the fall between 2019 and 2021 was 23%. But international enrolments represented nearly 20,000 EFTS in 2021, not much less than the level seen in 2016. Partly, that resilience is a consequence of cohort effects – students in multi-year programmes retaining their enrolments, either via online study or simply staying in New Zealand over the 2020/21 summer.
Cohort effects cushion a fall. But they drag out the pain too. With few new internationals able (or willing) to sign up in 2021 and 2022, the universities can expect that there won’t be new students to replace those who complete and move on. So there will likely be further falls in numbers of international enrolments in 2022 and 2023, even as the gate at the border is inched open painfully and slowly.
So the minister is correct – the domestic increase offset the immediate fall. But Grant Guilford wasn’t wrong either. It’s just that the effects of the drop in international enrolments are still in train.
And what about the financial implications
One of the problems with replacing international students with domestic is that the revenue that each type brings is different. On average, each international student brings in 60% more income for a university than a domestic student – in 2019, each domestic EFTS at a university generated around $16,100 in revenue for the institution, while internationals paid $26,500 on average in fees. So replacing international students with more domestic enrolments saw total fee revenue drop by almost 12% between 2019 and 2021. Total fee revenue in 2021 was lower than in 2018, even as total enrolments reached an all-time high.
Figure 2: Total university tuition fee revenue and enrolments in equivalent full-time student (EFTS) units, domestic and international, 2016-2021

Sources: Ministry of Education, Education Counts, Tertiary Education Commission, TEI financial performance by year, 2004 to 2020, university annual reports for 2021
So, what about financial performance overall
What really matters is how the universities managed the drop in fee revenue, especially the sharp drop that occurred in 2021. Of course, part of that drop was offset by the increase in government funding that accompanied the increase in domestic enrolments. The fall in fee revenue in that year – $145 million across the system – was almost balanced by an increase in government tuition funding of $117 million.
Overall, university revenue – when we include income from all sources, fees, government funding, research, contracting and other sources – fell in 2020 by $124 million but then rose by $190 million between 2020 and 2021. So collective revenue of the universities rose by $66 million, or 1.5%, between 2019 and 2021.
What is more, most universities managed their costs over this period. While revenue rose by 1.5% between 2019 and 2021, expenditure rose by less than 1%. As a result, profitability, measured as a percentage of revenue, fell sharply in 2020, reaching close to zero, before rebounding strongly in 2021 to reach close to 5%.
Figure 3: University system revenue and expenditure and operating surplus as a percentage of revenue 2016-2021
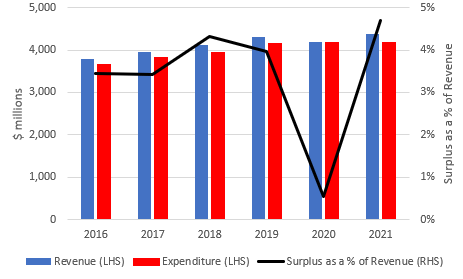
Sources: Tertiary Education Commission, TEI financial performance by year, 2004 to 2020, university annual reports for 2021. Note: Data is recorded net of one-off items.
And the predicted negative turnaround of $500 million? It turns out that the collective university operating surplus in 2021 – around $205 million – was $34 million or nearly 20% above the 2019 level. No turnaround at all.
In part, this result reflects management of personnel costs in the universities. Personnel expenditure rose in 2020 by 3.3% but then dropped back in 2021 (by 1.7%). Personnel is the largest single item of university expenditure, representing around 55%-56% in nearly all years. That figure rose to 57% in 2020, leading to the much-reduced surplus that year, evident in Figure 3. The suddenness of the onset of the pandemic and the severity of the restrictions meant that institutions were limited in their ability to address staffing costs in that year.
It’s not yet entirely clear from the available data whether (and to what extent) the tight controls on expenditure in 2021 came from reductions in staffing levels (as opposed to staffing expenditure) – New Zealand has terrible data on tertiary education staffing.
How did the individual universities get on
Of course, aggregating the eight institutions can mask considerable variations; the universities differ greatly in their reliance on international students. In 2019, more than 40% of Lincoln’s enrolments came from international students, with Waikato reaching nearly a quarter and Massey and Auckland a fifth; by contrast, only 13% of Otago’s EFTS were international. AUT earned nearly 22% of its 2019 revenue from international fees, with Lincoln at 17%. Otago, the lowest, earned only 7% of its revenue from international students. That all changed in 2020 when there was no intake of new international students, while a whole cohort left.
Figure 4: University dependence on international students 2016-2021
4a: Proportion of EFTS who were international – 2021 figures in red

4b: Proportion of total revenue from international students – 2021 figures in red
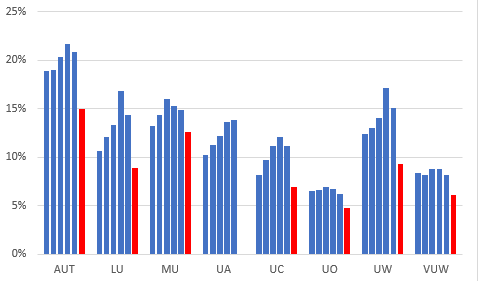
Sources: Tertiary Education Commission, TEI financial performance by year, 2004 to 2020, university annual reports for 2021. Note: The University of Auckland’s 2021 annual report does not break down its fee revenue between international and domestic student fees
All universities lost significant fee income. Across the system, international fee revenue fell from 13% in 2019 to approximately 9% in 2021. AUT, Lincoln, Canterbury and Waikato were especially affected by the drop in international fee revenue. Let’s look at what happened to profitability as a result.
Figure 5: University operating surplus as a percentage of revenue 2016-2021 – data for the years affected by the pandemic (2020 and 2021) in red
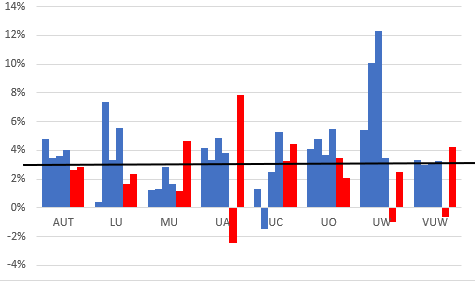
Sources: Tertiary Education Commission, TEI financial performance by year, 2004 to 2020, university annual reports for 2021. Note: Data is recorded net of one-off items. The black horizontal line shows the 3%, the benchmark used in TEC’s financial monitoring framework for “low risk”.
Three universities (Auckland, Waikato and Victoria) recorded an operating deficit in 2020 as the pandemic struck, but all eight were in surplus in 2021.
While all recorded a surplus in 2021, in four cases (AUT, Lincoln, Otago and Waikato), the surplus was below 3%, the benchmark used in the TEC’s financial monitoring framework for being seen as low risk.
Looking at the institutions’ performance on another of the TEC’s monitoring indicators – the core earnings ratio measure – only Lincoln was below the low-risk threshold. Compared with 2019, four of the universities were holding more cash in 2021 than in 2019. Of the four holding less cash, only in one (Waikato) was the difference significant.
Yes, the sector financial risk profile is up, but in none of the universities does the risk profile look to be extreme. These are likely to be manageable risks.
Comparing to Australia
Australian universities – especially those in the east coast states of New South Wales, Victoria and Queensland – also have high dependence on international student revenue. Their higher education sector has faced a near identical COVID management regime, with borders closing around the same time as ours and a set of lockdowns that forced much teaching online. As a southern hemisphere country, Australia’s academic year also mirrors the New Zealand one, so the pandemic hit both countries just as the first semester was getting under way. So it’s interesting to compare the two systems.
New South Wales – a system with 10 public universities – is a useful benchmark. International enrolments fell there by 13% between 2019 and 2021, less than the fall in New Zealand of 23% (possibly because enrolments there by Chinese students have actually increased since 2019). Like New Zealand’s universities, those in NSW were holding reasonable amounts of cash at the end of 2021.
The major difference is that NSW universities reduced their expenditure by nearly 6% in 2021 (mostly through reduced staffing costs), while NZ university expenditure was almost stable (up 0.8%). NSW universities reduced staff FTEs by 11% between 2019 and 2021. The cuts were especially significant among casual staff but the loss in non-casual FTEs was also significant – 7%. This led to very high surpluses in some universities – in three cases above 20% of revenue[1].
While we don’t yet know how many staff positions were lost in our universities, the modest fall (1.7%) in personnel spending between 2020 and 2021 suggests that restoration of financial stability wasn’t achieved by the NSW route – discarding many staff.
Looking at the overall financial performance of universities in the two jurisdictions, we see a similar trend in profitability since the pandemic, with reasonable strength in 2019, a significant deterioration in 2020 and a restoration to more healthy performance in 2021 – see Figure 6.
Figure 6: Number of universities recording a surplus or a deficit in New Zealand and New South Wales, 2019 – 2021

Sources: TEC, TEI financial performance by year, 2004 to 2020, NZ university annual reports for 2021, NSW Auditor-General (2022) Universities 2021, Guthrie J (2022) The state of NSW public unis – what the Auditor General’s report reveals – and doesn’t and Larkins F (2022) Income gains by New South Wales universities may be unsustainable
So …
Remember, Grant Guilford told the media that Victoria University | Te Herenga Waka would see an income drop of $50 million. Chris Hipkins was confident that the universities were financially strong and could manage through without needing additional funding.
The analysis here suggests that the minister received good advice. As for Victoria … the university’s revenue dropped by $21.2 million in 2020 but then recovered by $21.5 million in 2021. The university made a small deficit in 2020 (0.7% of revenue) but recorded a robust surplus of 4.2% in 2021.
But this isn’t the end of the story …
International student numbers will continue to fall as those currently in the system complete their studies, graduate and move on. The return of new international students is likely to be slow, so that it may take several years for the cohort effects of the open borders to flow through the system.
The sharp rise in domestic enrolments seen in 2021 has not been sustained, with 2022 intakes well below 2021.
Couple that with rising inflation … The annual consultation on domestic fee levels is expected to see increases limited to no more than 2.75%, in line with the increases in government funding rates. In effect, there is a real terms reduction in revenue levels for domestic students. Like the Australian universities, our institutions are likely to see the 2021 result as a one-off, very unlikely to be repeated in 2022.
It will take yet another year, maybe two, to see the full effects of the pandemic.
References used in this note
Guthrie J (2022) The state of NSW public unis – what the Auditor General’s report reveals – and doesn’t Campus Morning Mail
Larkins F (2022) Australian university staff job losses exceed pandemic financial outcomes Centre for the Study of Higher Education, University of Melbourne
Larkins F (2022) Income gains by New South Wales universities may be unsustainable Centre for the Study of Higher Education, University of Melbourne
Larkins F (2022) NSW uni finances: the best may have already happened: strong 2021 financial performances may be unsustainable Campus Morning Mail
Larkins F and Marshman I (2021) Impact of the pandemic on the 2020 financial health of 37 Australian universities Centre for the Study of Higher Education, University of Melbourne
Larkins F and Marshman I (2021) After 2 years of COVID, how bad has it really been for university finances and staff? The Conversation
New South Wales Auditor-General (2022) Universities 2021 Audit Office of NSW
Tertiary Education Commission (2016) Financial monitoring framework guidelines for tertiary education institutions Tertiary Education Commission
Data sources:
Annual reports of NZ universities for 2021
Australian Department of Education, Skills and Employment, Finance data for 2019 and 2020
Ministry of Education, EFTS enrolments in provider-based tertiary education 2012-2021
Tertiary Education Commission, TEI financial performance by year, 2004 to 2020
[1] It’s not clear how a 20% surplus would be treated in NZ nowadays. Those with long memories will recall a polytechnic making a similarly large surplus one year, leading the government to make significant changes in the funding rules – the offending institution was soon back in the red!
