1 The purpose of performance-based research funding systems
When we look at how research performance drives research funding, the first question that arises is what is the primary purpose? Is it to allocate funds? Or, rather, is it to measure performance? Which is primary – performance measurement? Or funding method?
The two are related but they are also different. That difference changes how we look at the system, how it should be designed. Reviewing performance-based research funding systems in 16 European jurisdictions, Sivertsen (2017) notes the difference between these two purposes[1]. He argues that, in the UK, the system has evolved; from a system originally set up to allocate funding, the primary focus has shifted to the measurement of research performance, with the exercise “… now inextricably bound up with UK research culture and policy.”
2 A mechanism for allocating funds ….
If we want a mechanism whose primary purpose is to allocate funds, then the criteria by which we assess the mechanism ought to be:
- It must allocate research funds to universities, fairly, with as much simplicity and transparency as possible
- It must do so in a way that builds an incentive for universities to deliver more and higher quality research, meaning it needs to recognise and reward excellent performance, and it needs to reflect the scale of each institution’s research
- It must reinforce and drive the outcomes we want from university research, meaning it must recognise performance across the three key values of university research – quality research that informs teaching, builds human capital and contributes to our society, our economy and culture (Smyth 2024 b,d).
It’s those principles that drove my proposal, in my UAG submission (Smyth 2024d), for a possible reconfiguration of the PBRF. My focus has been on the design of a funding mechanism, a response to the emerging concerns about the financial and compliance costs of the current PBRF design.
But that’s not straightforward ….
But there is a tension in that prescription between simplicity on the one hand and the need to recognise excellent performance on the other.
Recognising excellent performance implies taking a measure of performance. But performance in research, across the three outcome dimensions, doesn’t lend itself to simple measurement.
To take the most obvious example, the contribution of university research to society is multifaceted.
- It includes dissemination through the political process, through professional journals and professional associations, through environmental groups, through social services agencies, through arts organisations and events, through advocacy by researchers and academics, through news media ….
- It also includes research contracts: Research commissioned by firms, NGOs and community groups, research funded by philanthropists, research commissioned by government agencies (for instance on social issues like housing, migration, climate impacts, biosecurity, conservation, health or child poverty). And research funded by the three government sources of “public good” research funding – the Health Research Council, the Marsden Fund and the funds administered by MBIE. Collectively, external research income (ERI).
That represents a wide range of more or less formal mechanisms, some of it quantifiable, some impossible to quantify.
The approaches that could be taken in the research funding system to deal with that complexity are illustrated in the differences between the UK’s research excellence framework (REF) and the NZ PBRF:
- In the REF, there is a requirement for impact case studies, descriptive texts that outline the impact of each unit of assessment’s (UoA’s) impact, to be assessed by expert panels. In the 2021 REF, that meant 6,361 impact statements. The University of Bath and the University of Sheffield each submitted fewer than 100 (59 and 98 respectively), but Leeds had 116 and Manchester (a moderately large university in UK terms) had 150[2]. All those statements prepared in the universities. All assessed by panels.
- In the PBRF, the system uses a proxy measure, looking solely at the ERI – implicitly assuming that ERI is a reasonable index for the range of research transfer. Implicitly assuming that unfunded research transfer is distributed in roughly the same proportion as funded.
So there is a trade-off between precision and simplicity. The preparation and assessment load in the REF may (or may not[3]) be precise but it is indisputably complex and expensive. Reviewing the 2014 REF on behalf of the government, Stern (2016) explicitly rejected using a measure such as ERI to measure impact because it would not capture “… changes and benefits to the economy, society, culture, public policy or services, health, the environment or quality of life …”[4]. Stern, therefore recommended continuing to assess impact via peer review of case studies but supported by metrics (presumably, including ERI) (Stern 2016).
Using ERI in the PBRF is simple. It advantages Lincoln especially, and also Auckland and Otago[5] (Smyth, 2019). But, in the absence of any information on the value of unfunded research transfer, we can’t be sure whether the split of the funding is an accurate reflection of actual knowledge transfer or not[6]. Efficient, but the accuracy, the precision, is unknowable.
3 A mechanism for measuring research performance…
That discussion highlights the importance, for some people, of precision in the measurement of research. Those who approach the tension between measurement and funding from a researcher background often, as expected, place a focus on getting it “right” – just as Lord Stern did in the quote above.
But measurement of research, getting it right, is also complex.
Peer review
Peer review underpins nearly all assessment and evaluation of research – deciding what gets published, deciding what gets funded and by how much. Peer review is a form of “internal control” by the research community. Peer review is pervasive but there is actually little evidence that peer review is the best form of assuring quality (Wouters et al 2015).
The IAG (2023) argued for the retention of peer review while noting weaknesses of the approach, most notably:
- Peer review panels are good at identifying weak items but often struggle to agree on how to rank proposals that are good, excellent, outstanding.
- There is wide variation between panels and reviewers leading to divergent outcomes.
- Social effects (such as dominant personalities) affect scoring decisions.
- Certain groups, often those that are under-represented or marginalised, are strongly disadvantaged in peer reviewed assessment processes.
- Peer review panels tend to favour shorter-term, lower-risk projects over higher-risk innovative research.
- Interdisciplinary contributions and ‘non-conventional’ outputs may not be fairly credited.
Stern (2016) acknowledged the weaknesses of peer review. He pointed out that “… with the time pressures on some REF panels, maintaining consistency and quality … is … challenging”, a point that would be echoed by many critics of the QE in New Zealand who have often argued that QE panellists lack the time to be able to conduct first principles assessments of research and hence, revert to traditional benchmarks, even using such dubious criteria as journal impact factors[7].
Wilsdon et al (2015) argues that peer review “… is the least worst form of academic governance we have, and should remain the primary basis for assessing research … and for national assessment exercises”. Wilsdon identifies 11 weaknesses of peer review but notes that his consultation showed overwhelming support for peer review from the academic community.
Wouters et al (2015) discuss the heterogeneity of peer review – the term is used differently in different situations; there is no commonly accepted standard.
In a statement in support of the view that peer review, supported by metrics, is the gold standard of research assessment, Balboa et al (2024)[8] state that “ … the evidence base for challenges with peer review – its quality, accuracy, replicability, efficiency, equity, transparency, inclusion, and participation rates – is building …”
Inglis et al (2024) discuss the assessment of Research Environment statements in the 2021 REF. Modelling the ~18 million words that made up nearly 1,900 research environment statements, they found that factors relating to choice of topic and choice of words explain 69% of the score awarded by the panels; that is not to say that choice of words determine the assessment. But, reviewing the literature on decision-making, they state that the correlations they have established “… may well be, in part at least, causal.”
Their research then lays out a “recipe” for maximising the return on an impact statement. That reinforces the cautions of Stern (2016) and the IAG (2023). It also draws attention to some of the perverse results of the assessment of environment statements in 2021 – notably that a focus on how a discipline supports its early career researchers was associated with a lower assessment!
Smit and Hessells (2021) note the common criticisms of the REF peer assessments of social impact; they map out a set of structured set approaches that would be likely to lead to a more nuanced and fairer view than is typical in the REF by aligning the peer review approach to the task in hand.
And of course, the evidence advanced to support peer review (such as publications data and research grants) are all generated by peer review, so much of the peer review used in the PBRF quality evaluation (QE) (and also, in the REF) is in fact, peer review of prior peer review.
Questions remain over the validity of granular assessment of narratives.
The metric view …
But if peer review is problematic, so are metrics. With large, rich, complex datasets covering complex matters, there is the possibility of creating indicators that do not adequately represent what they purport to mean. That is especially the case with bibliometric measures, which can be distorted by differences in publication conventions across fields (Hicks et al 2015). For instance, bibliometric indicators of collaboration (which usually involve counts of multiply-authored papers) produce radically different pictures between biomedical science (where multiple authorship is almost universal) and the humanities[9]. That leads to the risk of poor or misleading judgements.
That led the bibliometricians at Leiden University to create a set of ten principles for the responsible use of bibliometrics (Hicks et al 2015). The first of those was that:
Quantitative metrics can challenge bias tendencies in peer review …. This should strengthen peer review, because making judgements … is difficult without a range of relevant information. However, assessors must not be tempted to cede decision-making to the numbers. Indicators must not substitute for informed judgement. …
while the sixth principle advises that use of bibliometrics should allow for differences in publication and citation practices between fields of research.
The first Leiden principle suggests that, for precision in the assessment and evaluation of research, peer review supported by metrics is the gold standard. That view was then echoed by Wilsdon (2015), Stern (2016) and the IAG (2023).
However, in his review of performance-linked research funding systems in 16 European jurisdictions, Sivertsen (2017) notes Stern’s conclusion but argues that high-integrity metrics-based alternatives are actually feasible in some situations, especially if the primary focus is on funding allocation (as opposed to on precision research measurement).
More fundamentally, any set of quantitative measures or targets creates a risk of goal displacement – meaning the attention of the participants turns to actions affecting the readout from the measure, whether or not their actions make any difference to the underlying goal (Sivertsen and Aagaard 2017). So that, if the goal was to enhance collaboration and if the indicator measuring collaboration was focused on co-authorship/multiple authorship, then participants could seek to increase the number of recorded authors, irrespective of any change in the value (or even the extent) of underlying collaboration.
And metrics have another related problem, especially if used for funding… The fact that a metric is used for funding will change behaviour. Goodhart’s law is that once a measure is a target, it ceases to be a good measure. Attaching funding to a measure essentially incentivises and accelerates goal displacement.
Of course, that doesn’t obviate the need for metrics. Nor does it suggest that bibliometric analysis is necessarily invalid. Rather, it invites us to design indicators well – in particular, to use comparisons that:
- normalise for field of research – meaning that in each field of research, calculate the mean for that field and represent each score as a fraction of the mean. In Leiden’s curation of the WoS data, citation indicators are presented as: X * the mean for articles in that field
- So a citation measure of 1.7 means 1.7 times as many citations as would be expected in that field of research.
- use fractional counting where appropriate – meaning that if there are 20 authors, 5 from University X, 3 from University Y and the rest from Z, then X gets 25% of the credit, Y 15% and Z 60%[10] (Smyth 2023).
4 Metrics vs peer review – the relation between the two
A key question – what is the unit of assessment?
Universities Norway (2021), in its guidance on the structure of academic careers, argues for the use of both metrics and peer assessment and that “… bibliometric indicators will be useful at the macro level, but are less suitable as a basis for decisions at the individual level …” They illustrate that tension in the diagram below:

In other words, at an institutional level, metrics are more valuable while, when we narrow our focus to the department or research group level, peer assessment achieves more importance, bibliometric measures less so. The most obvious area of abuse of bibliometrics is when they are applied to individuals – measures like the h-factor, for instance[11].
That reinforces the importance of matching measurement to the UoA. Obviously, in a research funding allocation system, the UoA will primarily be the institution, implying that metrics have greater value and should carry greater weight. While the UK REF does serve the function of allocating research funding, Sivertsen (2017) notes that the purpose of assessing the performance of research groups has become predominant, meaning the UoA in the UK is at the research group/department level, suggesting that peer review is correspondingly more important.
The predictive power of metrics in replicating the REF
In his independent review of the REF, Wilsdon (2015) responded to calls to make greater use of metrics in the REF by commissioning a study (HEFCE 2015) of the correlations between a wide range of metrics and the REF panels’ peer review assessments.
The study looked at 15 indicators of research performance at a paper-by-author output level, and calculated the coverage, correlation and predictive qualities of those indicators in relation to REF 2014 output scores for all units of assessment (HEFCE 2015). It found that “…individual metrics give significantly different outcomes from the REF peer review process, showing that metrics cannot provide a like-for-like replacement for REF peer review.”
The study also noted that, in some fields (Classics is an example), many of the research outputs submitted to the REF did not have a doi and therefore, couldn’t be found in any bibliometric dataset.
In other words, looking at the performance of each REF UoA, none of the 15 measures gave a very good prediction of how the UoA would have scored. Correlation coefficients were mostly positive but low[12] (although there was variation by field of research).
Applying the HEFCE (2015) methodology in the PBRF context, would have resulted in even worse correlations, I suspect; in part, that is because the PBRF definition of knowledge creation is very broad and includes such outputs as performances, exhibitions etc and where, in many fields, outputs can appear as monographs intended for professional use.
But is that the right approach?
If you want to measure research performance across many dimensions, field by field, unit of assessment by unit of assessment, peer review may not be perfect. But metrics, likely, is worse. If your focus is on the performance measurement, on the granular measurement of performance, then the consensus view – imperfect peer review supplemented by imperfect metrics – may be the best anyone can come up with.
But if your focus is on allocation of funding – the answer may be different. My earlier work (Smyth 2024 a,b,c,d) shows that, if we were to:
- substitute a measure derived from a count of a university’s indexed publications (a university’s, not a subset of a university) by broad field of research
- for the same six-year period as a PBRF QE
- apply the field of research funding differentials that apply in the PBRF
then the result would pretty much replicate the NZ universities’ shares of the PBRF QE funding. 98.5%[13].
It would be an incomplete measurement because there would be no account taken of any output without a doi. There would be little account taken of outputs that have a peculiarly local focus. No credit for performances or exhibitions.
But it would allocate funding accurately, in line with the QE. That is similar to the approach taken in Norway and the evolving approach in Italy – where a model based on the UK REF has evolved into a “semi-metric” approach (Sivertsen 2017).
And, if the count were of the number of publications that achieve 50% or more of the mean number of citations in the field, then it would measure scale, but with a quality overlay; it would mitigate the risk of goal displacement, it would frustrate attempts to game the target (Smyth 2024d). It would eliminate the risk of favouring quantity over quality to a degree. And it would maintain the high correlation with the QE (Smyth 2024d).
This is an approach that has a clear focus on creating a performance-linked research funding allocation mechanism. It doesn’t need to be precise; it needs only to be good enough to comply with the assessment principles set out in Section 2 above. And, to build confidence, it needs to provide a fair replica of the allocation of funding that occurred in the last QE.
5 People, culture, environment
One of the most interesting (but controversial) points in the IAG’s (2023) proposals for the 2029 REF was the focus on people, culture and environment (PCE); the IAG proposed that the REF should be weighted equally between outputs, impact and PCE, with the first two being conceived of at a UoA level while PCE is both an institutional characteristic and also a UoA characteristic (IAG 2023, Inglis et al 2024).
The IAG argument is that research practices in an institution are built on PCE meaning that PCE creates a foundation for the institution’s research programme. While output and impact assessments reward past performance, a PCE assessment is a leading measure; it is an assessment of the probability that the institution has the base from which to produce excellent research in the future – whereas most measures of performance (such as impact and outputs) are lagging indicators, reflecting what has occurred in the previous six (say) years. And, if the system is delivering funding for the coming period, some use of leading measures may be thought appropriate[14].
PCE includes “…the promotion of transdisciplinary research and address issues of diversity and career development in the workforce …” (IAG 2023, para 82).
The IAG also argues that the focus on performance in the REF has “…resulted in less diversity and more disciplinary conformity in the system… [and led to] attempts to ‘game’ the system (e.g., a REF-created transfer market and unfair hiring practices), potentially impeding research cultures” (para 19).
However, the IAG concedes that “… there is no clear consensus on what institutional characteristics or capabilities constitute a thriving research environment or culture and therefore, there are no standard criteria for assessment …” (para 60). So the proposal is to expand the current Research Environment component of the REF into a PCE component and to use expert/peer assessment, supplemented by evidence, to score institutions.
The authorities have bought into the principle (if not all the detail) of the IAG recommendation. But the proposal has not been universally endorsed.
Iain Mansfield, director of research at the Policy Exchange think tank, suggests that … [the] government should scrap the coming REF, rather than allow it to continue in its proposed form”. Philip Cowley, professor of politics at Queen Mary University, London, wrote: “My ‘professional suicide’ opinion is that environment—however defined—shouldn’t be a part of the REF process at all …The REF should grade research outputs—publications and impact. Environment is an input. If a place has a good research environment, that will (or should) lead to good publications. If it doesn’t, it won’t” (Smyth 2024e).
A reading of Inglis et al’s (2024) analysis of the 2021 REF Research Environment statements also raises questions about the validity of expert peer assessment of the sorts of matters covered in a PCE statement; the REF expert panels may well have readily identified the cases of where the research environment is weak. But making rational distinctions between gradations of strength is much harder.
It is true that the IAG proposal, which underpins the decisions on the 2029 REF, shifts the balance of the REF from performance and results and towards an assessment of some input elements. On the other hand, if, as the IAG argues, PCE provides the foundation for an institution’s work in creating and disseminating knowledge, then it can be seen as an important leading indicator of institutional research excellence.
Provided, of course, it can be reliably assessed.
Right now, a pilot is being conducted among volunteer UK universities, in preparation for the specification of the terms for the 2029 REF, a pilot that needs to be followed with interest by all analysts and advisors on research policy (Smyth 2024d).
6 The challenge of including PCE in research assessment
The IAG (2023) saw PCE as primarily assessed by expert panels, but that the panels should supplement their review with metrics. That raises the questions:
- is it possible to find indicators that give a good reading on PCE?
- how might elements of PCE be bolted on to a metrics-based performance-linked research funding elements in Aotearoa NZ to create a more rounded system?
This section and the next two address those two questions.
What is PCE?
The three components of PCE are not necessarily distinct.
People will include how many (and what proportion of) staff members are engaged in research in whatever capacity (as researcher, technical support etc) and how their research capability is nurtured (staff development). It may also address questions of the approach to research leadership and the training of novice researchers (PhD supervision), as well as how the development of early career researchers is supported[15]. It will also touch on questions of diversity. It will include things like conference funding and leave, study/sabbatical leave entitlements and usage.
Culture will canvas questions such as how the focus on research is experienced through the organisation and the actions taken by institutional (and disciplinary) leadership to promote the research culture (through systems such as visiting scholars, seminar programmes etc). It may include the extent to which members of the staff have leadership roles in research beyond the institution (for instance, editorial roles in journals). It may include review and critique practices.
Environment will include such features as (in no particular order):
- The organisation of research (ie, are there centres, groups etc)
- Approaches to the management of research infrastructure and research assets (databases, etc)
- Strategies to investigate/develop new research strands
- Strategies to foster inter-disciplinary research
- Strategies to build research collaboration across the system and internationally
- Approaches to creating opportunities for research contracting to industry and to preparing for bids to government’s public good research funds
- The approach to research dissemination.
Creating measures – the challenges
Much of what is covered by PCE above doesn’t lend itself to quantitative measurement – which is why the IAG called for peer review to be at the heart of the PCE assessment. And some are theoretically able to be captured by quantitative measures but carry difficulties.
To give one very obvious example …. Collaboration is something that may be thought to be readily quantifiable in bibliometric analysis. The Leiden CWTS curation of WoS bibliometric data gives both the number and the and proportion of papers that involve collaboration, short distance collaboration, long distance collaboration, international collaboration and industry collaboration, with upper and lower bounds, raw and normalised for research field, for ten three-year periods between 2010 and 2022.
We have seen co-authorship has grown substantially in NZ since the introduction of the PBRF (Smart, Smyth and Hendy 2013). But is co-authorship the same as collaboration?
Within an institution, within a department, even within a field of research, authorship conventions (implicit and explicit) can be different[16] eroding the reliability of authorship counts as an index of collaboration. But any hope of using bibliometric measures of collaboration was undermined by the conventions adopted by major international research collaborations like the Global Burden of Disease programme and the research drawn from CERN’s Hadron collider work – which led to papers with dozens, perhaps hundreds, even thousands of named authors, many of whom cannot have played any substantial role in the underlying research[17] (Smyth 2023)
A second problematic area is human resources – even such simple matters as counting the people active in research. People counts are notoriously unreliable because they involve categorisation of people’s work; for instance, is academic X, hired as a teacher/researcher but not terribly productive in research, best categorised as a teaching-only scholar or research active (and if so, to what FTE level)? Is technician Y involved in research and to what full-time equivalent (FTE) extent? The PBRF currently controls the question of which staff are research active by assessing someone as research active on the basis of the EP – in effect, by the research underway and produced. The matter is complicated further because official statistics on personnel (everywhere, not just in higher education) are fairly unreliable, with different institutions adapting statistical return manual instructions to their own HR practices (and hence, using marginally different interpretations). In the 2018 PBRF, the TEC attempted to manage this issue by engaging consultants (the Tribal Group, the firm that collects the data that underpins the government’s institutional cost analyses) to produce institutional staff counts – but even so, VUW managed to report more staff with QEs of C or above than it had staff (Smyth 2019).
Despite the problems of the 2018 PBRF HR data and despite the success of university CFOs in agreeing on reporting conventions in the PBRF[18], it’s hard to see universities’ HR divisions being capable of producing consistent data on how staff time is allocated. So any decision to use HR measures will need an independent view – such as that attempted by the TEC (with mixed results) when they engaged Tribal for the 2018 quality evaluation.
And the HR data problem is complicated by the fact that what we really need to know, in assessing PCE, is not necessarily quantifiable; knowing how much or how many tells us little about how well – the quality dimension. A good assessment needs both.
This suggests that constructing quantitative measures of PCE may be possible but will not be straightforward. Meanwhile, in the UK, the pilot of the PCE assessment for the 2019 REF is proceeding – and may develop some standardised quantitative measures to complement the proposed peer assessment of PCE statements. As I proposed in my recent submission to the UAG’s request for responses, “… New Zealand should follow the hunt for metrics in the UK currently underway with interest …” (Smyth 2024d).
A different type of measure …
One way of handling the complexity of measurement of PCE (and of other hard to rate concepts) is to use what we might call “ungraded measures” or “pass/fail” measures – effectively, prerequisites. That means that the university would have to demonstrate that it has the process claimed and that it operates as intended. But gradations of quality would not be assigned – for instance, the panel would confirm the existence, nature and effectiveness of its researcher development programme, but without any attempt to assess whether UA’s is better than UO’s.
That sort of measure was proposed in Smyth (2024b,c) for research impact cases. In that proposal, I suggested that each university would have to develop and present a given number of short case studies (in a prescribed form) that assemble evidence to demonstrate the impact of its research – beyond (but possibly also including) ERI. The case studies would have to be cleared by experts, but there would be no attempt to grade them.
That approach gets by the acknowledged problem (identified in IAG (2023)) that expert panels are good at separating the poor from the acceptable but that they are less good at differentiating levels of quality among the acceptable. It is also a far lighter task.
Ungraded measures are also a way of assessing inputs. For example, among a list of PCE factors might be the existence of a mentoring programme for early career researchers. Universities might be asked to specify the elements of their mentoring approach – for assessment as acceptable or not.
… and another way of measuring HR factors …
The difficulty of getting robust administrative measures of staffing is a particular challenge for PCE assessment – PCE is, ultimately about how universities recruit, organise, develop, reward and retain the people who will produce research.
One way to get around the challenge of staffing or HR measures, there may be a need for a common university academic staff survey, run by the TEC across the eight universities that gives a measure of staff assessment of the research culture, their access to development opportunities, etc.
That is something that would likely be resented by universities’ management, but it may be necessary, if there is a need for measures to complement an ungraded measure such as a PCE statement.
… setting the unit of assessment …
The first point to establish is whether the analysis will be institutional or department/research field-based.
Following the reasoning of the IAG (2023) and taking account of the advice of Universities Norway (2021), I would argue for measures that are institutional. PCE is, as the IAG argued, a university responsibility, even if it is, in essence, an aggregation of what occurs across faculties and departments. Narrowing in on field of research will be both more onerous and likely to produce aberrant results, given the small scale of some units across the system. Plus, following the scheme in Figure 1 above, an institutional focus is more likely to suit metrics.
… areas of focus
Not all of the items discussed above as contributing to PCE lend themselves to quantifiable indicators. Those where we might explore quantitative measures are:
- Research capability
- Research training
- Support of and development for researchers
- Research leadership
- Transdisciplinary research
- Research transfer
And in those categories, there will be both financial and HR measures, also some bibliometric measures. But we need to recognise that those measures probably won’t capture the quality dimension, leaving the need for the two alternative approaches discussed above – the ungraded assessment and the academic staff survey.
7 Creating an institutional PCE statement
Given the complexity outlined in the discussion above, including PCE in the research funding mechanism will require each university to produce a PCE statement to a prescribed template covering the key aspects PCE discussed above – capability, training, support for researchers etc.
This should – like the impact statement proposed for the PBRF (Smyth 2024b,c) – be a prerequisite measure, an ungraded measure. Assessed as acceptable or not by experts but not graded. The experts’ comments should be public – so as to create incentives for universities to have excellent PCE practices and systems. A PCE statement is an opportunity (like the Research Impact Statement (Smyth 2024b,c)) for the university to showcase its strengths and to build its reputation as an employer.
But, as the IAG (2023) proposed for the assessment of PCE in the 2029 REF, the statement would need to be supported by evidence. Meaning we still need to explore the questions of how to develop hard data on PCE.
An academic staff survey
As noted above, a survey of academic staff should be created that asks questions that lead to the creation of indicators that can be used in support of the claims in the statement. For instance, the availability and take up of development opportunities, the opportunity to take on mentor roles or research leadership roles, the encouragement to collaborate across disciplines, with other institutions and with potential industry research users, …
Some possible quantitative measures
Research capability: As noted above, administrative data would be likely to deliver unreliable measures; any attempt to count the number of academics active in research would likely fail. The problem is compounded by the need to standardise treatment of technicians (which would bias the count against universities with a strong focus on non-STEM fields) and research assistants and other support staff (lest we have to count every library staffer as a researcher).
Research training: The focus here should be on doctoral students, which is simpler than delving into the diversity of sub-doctoral research qualifications. One measure is to do with the scale of doctoral training. Another angle is to do with whether doctoral students’ research gets published.
Note, however, that counting doctoral students could risk confounding the PBRF RDC measure. Because we are looking here at environment and culture, however, the focus shifts to the research community in the department (ie look at enrolments) rather than outputs (completions).
Support for and development of researchers: One area of focus should be on sabbatical leave take-up and expenditure (rather than entitlement) and conference leave expenditure. The focus on institutional PCE (rather than departmental) means that technical support can’t come into the measures (despite its importance in creating a research environment) because of field of research differences. Things like seminar programmes could only be captured by the staff survey.
It would be useful to be able to distinguish between early-career researcher (ECR) support from the rest, given the findings of Inglis et al (2024) that there is a negative correlation between the focus on ECR in the Research Environment statement in the 2021 REF and the rating of those Research Environment statements. In this area, it would also be useful to give an equity and diversity break down of measures.
Research leadership: Research leadership, in this context, is taken to be the number of staff who take on national or international roles, in particular journal editorship, membership of research governance boards etc. It’s not clear what criteria would apply to defining a research governance board, or if there are enough to make that a meaningful measure.
Transdisciplinary research: Possibly the only reliable way to quantify the extent of transdisciplinary research is to count transdisciplinary research outputs – which can then be seen as a proxy for a transdisciplinary culture.
Determination of a paper’s disciplinary focus is not straightforward and would require detailed scientometric analysis. In the past, the discipline of a paper was inferred from the orientation of the journal in which it appeared (see Thelwall and Field 2023). More recently, CWTS Leiden University and other researchers (eg Dalton et al 2021) have used large scale analysis of relations between citations to assign a paper to one or more micro fields which can then be aggregated into subject categories and main fields. The results of that sort of analysis could be used to construct an index of inter/trans disciplinarity[19].
Research transfer: Note that this area could echo/make use of the ERI measure in the PBRF plus the proposed (ungraded) research impact statements discussed above and in Smyth (2024d). The ERI and impact statement essentially proxy the same thing, but from a research output/performance (rather than PCE) perspective.
Another approach to this area is bibliometric, using the industry collaboration measures from CWTS. In the period 2019-2022, industry collaboration was found in nearly 3,000 indexed papers from the seven NZ universities covered in CWTS, a little above 6% of all papers[20]. While academic collaboration may be a meaningless measure, industry collaboration is likely to be less subject to distortion (although there is a risk of gaming it).
Table 1, below, sets out and comments on some of the possibilities.
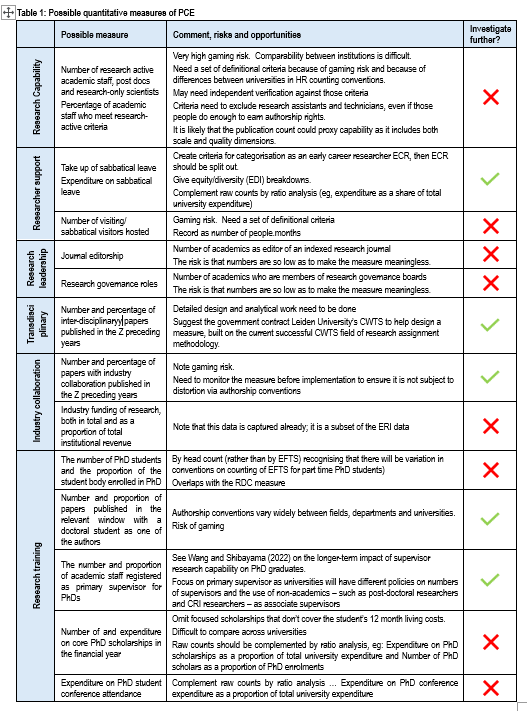
There would be other possible measures; in particular, the REF PCE pilot will undoubtedly generate additional options. There is a need then to investigate the detailed design and specification of those selected for further investigation.
8 Creating a new PBRF
Adding the PCE statement, as discussed above, to the proposal discussed in my earlier work would see:

If the research performance measures were to retain the present weightings in the PBRF and if the two new elements – the impact statement and the PCE statement – were to carry no funding weight (ie, as suggested in Table 2), then the new system would allocate the funding shares in a way that is broadly in line with the present PBRF. There would be winners and losers, but the gains and losses would be manageable, especially if there were a transition arrangement.
Applying it to the 2018 PBRF QE, the net shift of funds across the seven large universities would have been of the order of $4.4 million (or 1.5%), with UA seeing its PBRF funding rise by 1.6%. The two biggest losers (UO and AUT) would see their share of the PBRF funding drop by a little less than 1 percentage point (from 6.8% to 5.8% in AUT’s case and 21.2% to 20.4% for UO). The reductions in dollars would be AUT: $2.8m and UO: $2.5m. (MU would also have experienced a reduction but of the order of $210k) [21] (Smyth 2024c).
A comment on incentives
An objection that the two zero-weighted, ungraded elements added to the PBRF would carry little incentive to modify institutional behaviour and performance. That is not the case; the PBRF incentive system is as much a matter of reputation and pride as funding.
Good impact and PCE statements will help universities recruit, they will help the universities’ in their relations with international peers, with government agencies, with industry partners, with philanthropists and other funders.
The need to lace the statements with quantitative data will provide a grounding to the statements, prevent them from lapsing into pure puffery.
And on compliance costs
The removal of the QE obviously removes much of the cost of the PBRF to government. It also removes the burden of preparing an evidence portfolio from nearly all university academic staff (replacing that effort with the obligation to complete a staff survey every X years). Instead, the effort of drafting the two statements would fall on a small number of university management and leadership staff. That could be a trade-off that institutions (maybe, even the trade union) would welcome.
Research funding outside the universities
The proposal in this paper was designed around the expectation that it would assess and allocate funding to institutions that are committed to research over all, or nearly all, of their academic programmes, that participate in the international research community across many disciplines (and hence, have large numbers of indexed outputs), that compete for contestable research funds, that offer research-based qualifications – that have research as a central part of their mission. It suits universities because they have a statutory obligation to conduct research and to ensure that most of their teaching is conducted by those active in knowledge creation.
That is different from the research profile of wānanga, polytechnics and PTEs, some of whom earn PBRF funding now. The new PBRF is even less suitable for those institutions – largely because of the two ungraded components, but also because of the use of bibliometric measures (rather than first principles assessment).
My view is that the government should seek a new, quite different approach to funding research outside the universities.
Index of abbreviations

Bibliography
Aksnes D and Sivertsen G (2023). Global trends in international research collaboration, 1980- 2021. Journal of Data and Information Science, 8(2), 26–42.
Balboa L, Gadd E, Mendez E, Pölönen J, Stroobants K and Toth Cithra E (2024) The role of scientometrics in the pursuit of responsible research assessmentLSEImpact Blog
Dalle Lucca Tosi M and dos Reis J (2022). Understanding the evolution of a scientific field by clustering and visualizing knowledge graphs. Journal of Information Science, 48(1), 71-89.
Dalton A, Wolff K and Bekker B (2021) Multidisciplinary research as a complex system International Journal of Qualitative Methods Volume 20: 1–11
Gadd E, Holmes R and Shearer J (2021) Developing a method for evaluating global university rankings Scholarly Assessment Reports
HEFCE (2015) The metric tide: supplementary report: correlation analysis of REF2014 scores and metrics UK Research and Innovation
Hicks D, Wouters P, Waltman L, de Rijke S and Rafols I(2015). Bibliometrics: The Leiden Manifesto for research metrics. Nature 520, 429–431 (2015)
Holmes R (2021) THE World University Rankings: indicator correlations University Rankings Watch
International Advisory Group (IAG) (2023) Future research assessment programme Jisc
Koltun V and Hafner D (2021) The h-index is no longer an effective correlate of scientific reputation. PLoS One. 2021 Jun 28;16(6):e0253397Sivertsen G (2017) Unique, but still best practice? The Research Excellence Framework (REF) from an international perspective Palgrave Communications volume 3, Article number: 17078
Sivertsen G and Aagaard K (2017) The effects of performance-based research funding systems R-QUEST Policy Brief no. 2
Smart W (2013) Analysis of the impact of the PBRF: interim findings Ministry of Education
Smart W, Smyth R and Hendy S (2013) An analysis of collaborative journal article authorship at New Zealand universities Ministry of Education
Smit J and Hessels L (2021) The production of scientific and societal value in research evaluation: a review of societal impact assessment methods Research Evaluation, 30(3), 2021, 323–335
Smyth R (2024a) The PBRF challenge: Part 1: the issues Strategy Policy Analysis Tertiary Education
Smyth R (2024b) The PBRF challenge: Part 2: designing an alternative Strategy Policy Analysis Tertiary Education
Smyth R (2024c) The PBRF – a postscript Strategy Policy Analysis Tertiary Education
Smyth R (2024d) UAG submission, Q4 Part 2: Incentives and policies to promote excellence in research Strategy Policy Analysis Tertiary Education
Smyth R (2024e) What the PBRF cancellation might say about the future of its British equivalent LSE Impact Blog
Smyth R (2023) Much ado about not very much Strategy Policy Analysis Tertiary Education
Smyth R (2019) External research income Education Central
Stern N (2016) Building on success and learning from experience: an independent review of the research excellence framework UK Government
Thelwall M and Pinfield S (2024) The accuracy of field classifications for journals in Scopus Scientometrics (2024) 129:1097–1117
Traag V (2021) Inferring the causal effect of journals on citations Quantitative Science Studies (2021) 2 (2): 496–504.
Universities Norway (2021) NOR-CAM – A toolbox for recognition and rewards in academic careers Universities Norway
Wang J and Shibayama S (2022) Mentorship and creativity: Effects of mentor creativity and mentoring style Research Policy 51
Wilsdon J et al (2015) The metric tide: report of the independent review of the role of metrics in research assessment and management UK Research and Innovation
Wouters P et al (2015) The metric tide: supplementary report: literature review UK Research and Innovation
Wykes T, Lipczynska S and Guha M (2013) The h-index, the citation rating, impact factors and the aspiring researcher Journal of Mental Health, 2013; 22(6): 467–473© 2013 Informa UK, Ltd
Zuo Z and Zhao K (2018) The more multidisciplinary the better? The prevalence and interdisciplinarity of research collaborations in multidisciplinary institutions Journal of Informetrics vol 12, issue 3 pp736-756
Endnotes
[1] See also Asknes and Sivertsen (2023)
[2] The University of Oxford managed to squeeze in under 200 – with 198.
[3] See the discussion of the adequacy of peer review later in this paper.
[4] Stern 2016, pp43, 44
[5] Over the four years to 2018, LU academics generated around $120k/FTE against $75k/FTE at UA and $74k at UO.
[6] However, Lincoln could argue that the applied and inter-disciplinary nature of much of their research means that they are correspondingly downgraded in the QE.
[7] Journal impact factors are an especially worrying bibliometric factor – see Traag (2021)
[8] The authors of this statement were adherents of the Coalition for Advancing Research Assessment (CoARA)
[9] See Smyth (2023), Gadd et al (2021) and Holmes (2021). That issue is compounded by large-scale international research programmes (like the Global Burden of Disease programme) that, as a matter of policy, include multiple contributors as authors; they can have dozens, even hundreds, of authors and tend to be extremely highly cited. A paper from the GBD or from CERN’s Hadron Collider research can attract tens of thousands of citations.
[10] The discussion in Smyth (2023) sets out how the failure to use fractional counting has a destabilising effect. In particular, it all but destroyed the credibility of the Times Higher Education’s ranking system.
[11] See for instance, Wykes et al (2013) and Koltun and Hafner (2021)
[12] Looking across all fields, the variable with the highest Spearman’s correlations were around 0.4. In the fields of economics and clinical medicine, correlations for some variables rose to about 0.7, even 0.75. Some variables had negative correlations for some fields.
[13] See Smyth (2024c) and its appendix for the calculations. The analysis there used Pearson’s correlations (whereas HEFCE (2015) used Spearman’s correlations). Closeness to the PBRF is not necessarily an ideal (Smyth (2024c). However, the most recent (2018) PBRF QE provides a benchmark against which to assess the “fairness” of any alternative.
[14] In practice, of course, the difference between leading and lagging indicators is slighter than implied by that discussion.
[15] Noting, however, the surprising finding in Inglis et al (2024) that paying a great deal of attention to ECR in the 2021 REF Environment Statements was negatively correlated with the assessment.
[16] For example, there may be explicit or implicit authorship obligations as a consequence of access to major research resources (such as longitudinal datasets or major biomedical resources).
[17] These projects had the incidental effect of destabilising some international university rankings systems, especially the dubious system developed by Times Higher Education (Smyth 2023, Holmes 2021).
[18] That’s been done twice before for the PBRF. A common approach to reporting research income for the PBRF was agreed by university CFOs in 2003 and, following the 2012/13 PBRF review, the CFOs agreed on conventions for classifying the source of ERI.
[19] See also Dalle Luca Tosi and dos Reis (2022). The wrong way to measure inter-disciplinarity is to look at the disciplinary orientation of the journal in which a paper appears.
[20] The figures range from 5.5% at UO, 5,6% at VUW … to 8.5% at MU. Note that LU is too small in some fields to meet the criteria for inclusion in the Leiden curation of the Web of Science data.
[21] Smyth (2024c) and its Appendix consider the effects of a number of variations of this – for instance, altering the 55/25/20 weighting between publications/RDC/ERI
