So far, one of NZ’s eight universities – the University of Waikato – has not yet tabled its annual report for 2022. As a result, some of the analysis in this paper is incomplete.
Waikato represents around 7.5% of the university system’s total enrolment and less than 7% of the system’s staff complement. Whatever Waikato’s annual report shows will not change the overall conclusion of this paper – that, financially, 2022 was the worst year for the NZ university system since the reforms of 1990.
This paper will be updated when the Waikato annual report is through audit, tabled and published.
We all know that it’s been a tough time for universities. Job cuts are planned at Otago, Massey, Victoria and AUT. Canterbury forecast a deficit in 2022 but the result was twice what was forecast. Of the seven universities whose 2022 annual reports have been published, five have reported deficits. Five! A majority. That makes 2022 the worst year for universities, financially, since the tertiary education system was reformed in 1990.
That is despite the fact that 2021 was the most profitable year for the system in 20 years – with all eight universities in surplus and a collective operating surplus across the system of 5% of revenue.
And the outlook remains bleak; that’s what is driving the cuts – some universities are forecasting worsening deficits unless revenue improves dramatically or unless costs fall dramatically.
Is this just a version of long Covid? A sustained hangover from the pandemic? And what is the outlook?
With the universities’ annual reports for 2022 being released one by one, we can start to look more closely at how the system performed in 2022.
Enrolments fell but costs remained high … so finances are squeezed
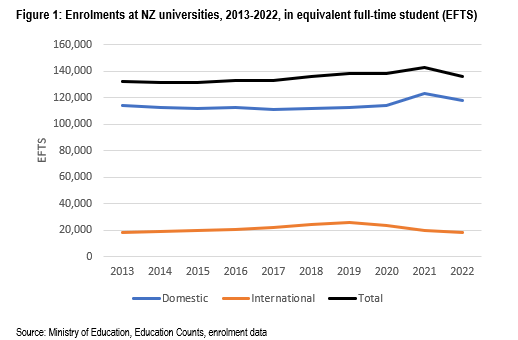
The pandemic meant that 2022 saw a further fall in international enrolments; restrictions in travel and uncertainties in entry rights meant few new international students were able to show up, while others continued to defer their studies or else completed qualifications online and departed. That was a continuation of the pattern of the previous year – more of the same. The difference between 2021 and 2022 was that the stronger labour market meant the end of the sugar hit of surging domestic enrolments[1] that offset the fall in internationals and drove the healthy surpluses of 2021.
The system surplus as a percentage of revenue was close to zero in 2022 – as it was in 2020, the first year of pandemic effects. In fact, had the University of Auckland not made a super surplus (close to $100 million, its largest operating surplus[1] in 20 years), the result would have been much, much worse – a deficit of more than 2% of revenue, instead of a combined surplus of 0.6%.
University system revenue did grow in 2022 (by 3%) but it’s student-driven revenue that drives profitability[2]. The problem is that costs rose faster – by 7%. Spending on university staffing rose by 5% across the system, with average cost per FTE staff member up by 6%. With staffing costs accounting for around 55% of all university expenditure, profitability is also critically dependent on staff costs. While student-driven revenue goes up and down as numbers change, the costs of serving those students are sticky; it takes time to recruit staff during an upturn and labour law and practice mean that it takes time to shed staff (just ask AUT!). Besides, when it comes to academic staff, universities need to consider the strategic cost of cutting research capability and disciplinary expertise; how can an institution maintain its standing in a discipline if it loses specialist capability. Any cutting requires care, subtlety, a clear view of the risks and opportunities … that takes time. And, as for professional staff, there are real economies of scale – the number of staff needed to service 11,000 students is not materially different from the needs of 10,000 students.
So one (crude) measure of university efficiency is the ratio of students to staff – total EFTS, domestic and international to total FTE staff, academic and professional. On this measure, 2022 gives the lowest reading in 20 years.
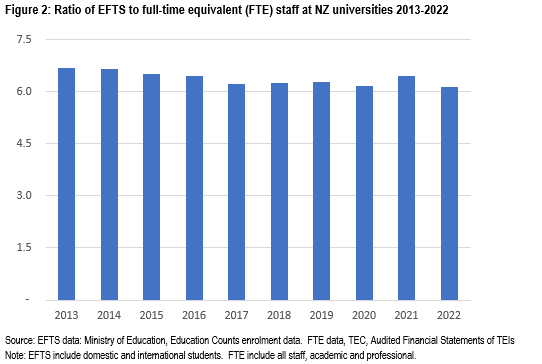
Of course that’s a crude measure, but it does reflect university system profitability. The differences year on year may not look large in the graph; but universities run on fine margins so the effects are significant. Figure 3 adjusts the data on EFTS for the fact that each international student generates more revenue than a domestic student and adds data on university system financial surplus, as a percentage of revenue.

Statistical analysis shows that the adjusted EFTS to FTE ratio is highly correlated to profitability[1].
The government funding rules haven’t helped …
One of the problems all institutions face is that the government fixes prices for domestic students; the government determines the funding rates and it controls domestic fee increases. Given the costs to government of domestic fee increases[2], the government has a financial incentive to limit fee increases. And, of course, there is high political risk of high fee increases, especially in a period of high inflation. Fee increases were limited to 1.7% for 2022 and 2.75% for 2023 over a period when inflation was pushing 7%[3].
And the pandemic continues to affect international enrolments …
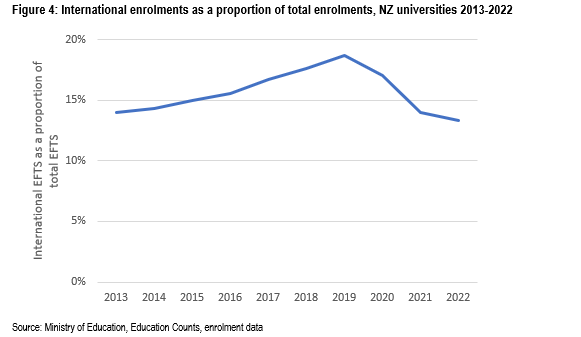
In effect, international enrolments provide the buffer in the NZ university business model; universities have greater control over their international student revenue. Each international student generates something like 1.6 times the revenue of a domestic student. Therefore the proportion of internationals in a university’s student body is an important driver of profitability.
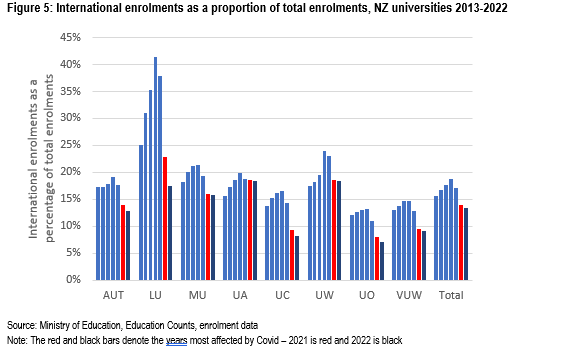
And this is where the long-term effects of pandemic have been severe. The proportion of international enrolments was the lowest in 2022 for a decade.
That applies in each of the eight universities.
And, unfortunately, it’s likely to get worse before it gets better. NZ’s competitors – especially Canada but also Australia and the UK – were faster to offer certainty of entrance to international applicants. And cohort effects – the fact that more of the current students will have completed and departed, offsetting the expected increase in new international entrants in 2024 – mean that we are still some years off a return to the heady levels of 2019.
The universities’ finances in 2022
It’s a sorry picture. The onset of the pandemic saw the combined surplus of the universities fall from 4% or revenue to less than 1%. As a result of the surge in domestic enrolments in 2021, plus careful management by the universities led to a good result in 2021 – 4.8%. In 2022, this has fallen back to less than 1%.
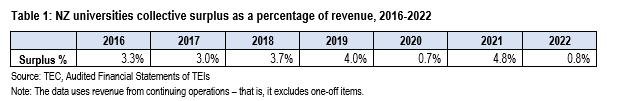
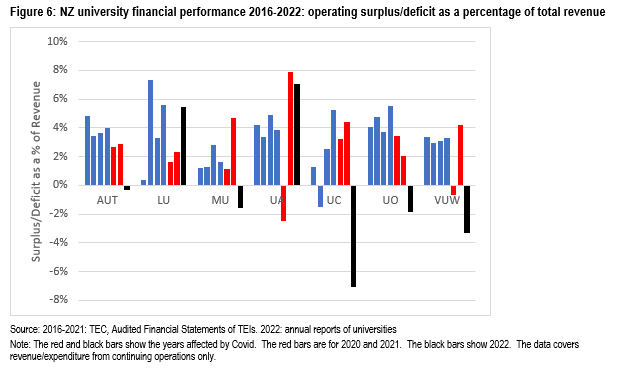
The severity of the turnaround between 2021 and 2022 is clear when we look at the trend in each institution’s surplus as a percentage of revenue. Take out the University of Auckland and it makes for a much more sorry picture – a collective deficit of 2.3%.
This is not to imply that any institution faces an immediate viability risk. All have reasonably healthy cash balances. All have positive core earnings ratios[1] meaning that they can pay their bills. But to do so, a university that is in deficit has to dip into its reserves, reserves that have been accumulated to pay for maintenance, renewal and augmentation of their capital base, their equipment, their space, their facilities, ….
In other words, the effect of a deficit is to compromise the institution’s need to invest in the quality of its work.
A smallish deficit or a one-off deficit is manageable. Large and repeated deficits represent threats that must be faced by the university’s leadership.
How have they managed in Australia
A year ago, in my review of the universities’ 2021 annual reports, I noted that their high surpluses and strong financial performance mirrored the situation of Australian universities.
The same is true of 2022. Poor university financial performance has been common across Australia, including at the rich Group of Eight[2] research intensive universities, all eight public universities in Victoria and nine of the ten NSW institutions. The challenges were the same as those confronting institutions in this country – a fall in domestic enrolments and a sluggish international recovery. Their situation has been compounded by the exposure of the Australian universities to investment markets; their 2021 investment gains disappeared entirely in 2022. As a result, there were some spectacular reversals in Australia – for instance, the University of New South Wales went from a surplus of $A 305 million to a deficit of $A 168 million in a single year, a turnaround of $A 473 million in a single year. Even the one surplus institution in NSW, the University of Sydney, had a large turnaround between 2021 and 2022, with its $A 1 billion+ surplus in 2021, dropping to around $A 300 million in 2022.
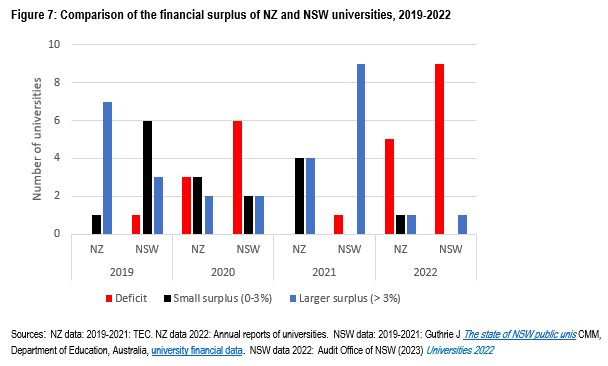
The NSW Audit Office’s report to the parliament of NSW on the public universities’ performance illustrates the turnaround between 2021 and 2022.
The similarity in the pattern between NZ and NSW is illustrated in the figure below.
Looking forward …
In 2022, the universities saw a decline in domestic enrolments of nearly 4%. The Ministry of Education’s forecast outturn for 2023 is for a fall of a further 5.3%. And the Ministry expects only very small annual increases from then through to 2027, when the enrolment is expected to be around 1.5% up on 2023. Those forecasts have a history of being very, very accurate. That means that there is unlikely to be any respite for the universities from the domestic market.
And, I noted above that international students are likely to recover only very slowly.
Budget 2022 saw funding rates rise, an increase funded out of savings resulting from the fall in enrolments. In other words, the increase had the effect of softening some of the effects of the fall in enrolments. But meanwhile, costs are increasing across the economy. The economies of scale at the universities are being eroded. Wage pressures are mounting.
In the circumstances, it’s no surprise that some universities have looked hard at their finances, have developed scenarios and forecasts and have decided that there is no way of avoiding painful cuts. The alternative is the path of a thousand cuts – the loss of the capacity to invest in the quality of their institutions. However painful and despite the risks to institutional capability and credibility, we have to acknowledge that those universities that have proposed cuts are acting prudently.
References
The 2022 annual reports of AUT, Massey and Lincoln Universities and the Universities of Auckland, Canterbury and Otago provided much of the information used in this note. The following additional sources of information were consulted:
Australian university 2022 results
NSW 2022 annual reports – there’s Uni Sydney and everybody else Campus Morning Mail 1 6 23
NSW universities plunge into the red as finance markets turn Times Higher Education 1 6 23
Record losses at Australian universities Times Higher Education 31 3 23
Universities 2022 Audit Office of NSW
New Zealand universities’ plans for job cuts
AUT planned job cuts 1 News 5 9 22
AUT ordered to restart redundancy process Stuff 20 1 23
Massey University planned job cuts RNZ 10 11 22
Massey University planned job cuts Stuff 18 4 23
University of Otago planned staff cuts RNZ 31 5 23
Victoria University of Wellington | Te Herenga Waka planned job cuts RNZ 24 5 23
Victoria University of Wellington | Te Herenga Waka planned job cuts NZ Herald 24 5 23
The risks of downsizing our universities – Nicola Gaston, The Spinoff 31 5 23
Data sources
TEC
Financial monitoring framework
TEI financial performance by year
Ministry of Education
Student Loan Scheme Annual Report
Australian Department of Education
Higher education providers financial data
Reserve Bank of NZ
[1] The core earnings ratio is one of the viability measures in the TEC’s monitoring framework. It is the institution’s EBITDA (earnings before interest, taxation, depreciation and amortisation) as a percentage of total revenue. Because universities have high assets, they are required to make high depreciation and amortisation provision. That is non-cash expense, designed to ensure that the institution has the reserves to maintain its capital assets. Therefore, an institution in deficit can meet its obligations through its reserves, essentially deferring maintenance of its capital base.
[2] Australian National University, the Universities of NSW, Sydney, Melbourne, Adelaide, Queensland and Western Australia and Monash University.
[1] The correlation coefficient is 0.72. The adjusted EFTS to FTE ratio explains just over 50% of the variation in surplus as a percentage of revenue.
[2] Because most students are entitled to borrow their fees from the government’s student loan scheme, the government ends up paying something like 40% of the cost of an increase (refer to the Student Loan Scheme Annual Report for the detail). Also, the free-fees scheme for year one domestic students means the government pays the entire fee for a proportion of the domestic student body.
[3] This uses CPI for Q1 in each year using the RBNZ calculator. The actual readings were 6.9% for the 2021 to 22 CPI, and 6.7% for 2022 to 23.
[1] Before non-recurring/abnormal items.
[2] Student-led revenue comprises around 65% of all university income. Research revenue is around 25% of the total. However, research makes only a small contribution to university profitability; the costs of research are high and it is the nature of research that a researcher can always a little further or buy a little more equipment or materials to complete the project. Even commercially funded research is unlikely to come in significantly under budget.
[1] The factors that predict the gross level of university enrolment are the size of the population cohort and the youth unemployment rate. See the discussion of this in the Ministry of Education’s forecast model.
